Global Visual Configuration Software Market Size (2023-2030)
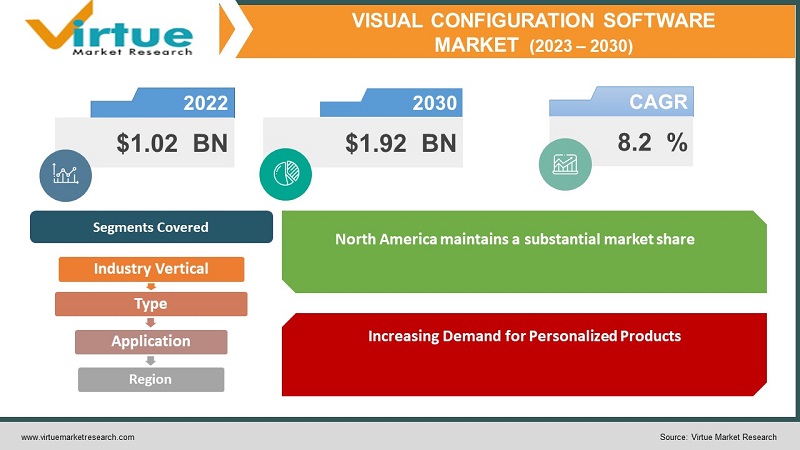
The Global Visual Configuration Software Market was estimated to be worth USD 1.02 Billion in 2022 and is projected to reach a value of USD 1.92 Billion by 2030, growing at a CAGR of 8.2% during the forecast period 2023-2030.
The desire for individualized products and the increased acceptance of digitalization across numerous industries have spurred a recent significant rise in the visual configuration software industry. With the use of this software, companies can give clients dynamic, visually appealing experiences that let them personalize and customize products to suit their preferences. This article will examine the market for visual configuration software, including its major players, important drivers, and emerging trends. Customers can visualize and customize items in real-time using visual configuration software, which provides a user-friendly interface. By giving clients access to a virtual platform where they can experiment with various configurations and see the results right away, it does away with the need for intricate product catalogs and drawn-out communication procedures. Several industries, including those in automotive, furniture, fashion, electronics, and industrial equipment, have embraced this technique.
The market for visual configuration software is expanding as a result of rising consumer demand for customized products and the industry’s adoption of digitalization. By giving customers dynamic and visually appealing experiences, organizations may increase customer happiness and boost revenue. The future of visual configuration software is bright with the integration of AI, ML, AR, and VR technologies, providing even more sophisticated and individualized experiences for clients.
Global Visual Configuration Software Market Drivers:
Increasing Demand for Personalized Products
The rising demand for personalized products is one of the key factors boosting the growth of the worldwide visual configuration software market. Customers demand distinctive and personalized experiences in today's consumer-driven market, and businesses work hard to deliver on these demands. The provision of individualized products to customers by businesses is made possible in large part by the use of visual configuration software. Businesses can provide clients with dynamic and immersive platforms to personalize products to their preferences by utilizing visual configuration software. This gives buyers the power to select particular features, patterns, colors, and other criteria, resulting in a product that completely suits their unique wants and preferences. Real-time visualization and experimentation with various setups improve client satisfaction and promote a sense of ownership. Additionally, individualized goods are viewed as having a higher value, which increases consumer happiness and loyalty. By meeting the rising need for customization, companies that provide visual configuration software get a competitive edge in the market.
Adoption of Digitalization in Industries
Another important factor affecting the global market for visual configuration software is the introduction of digitalization in various sectors of the economy. Businesses from a variety of industries are adopting digital transformation to improve efficiency, streamline operations, and optimize processes. By enabling firms to automate and digitize the product configuration process, visual configuration software completely complies with this digitalization trend. Product configuration has historically included human labor, intricate catalogs, and drawn-out communication procedures, which has resulted in mistakes, delays, and higher prices. By offering a digital platform where users may interactively configure products, visual configuration software removes these difficulties. It shortens the configuration process, reduces mistakes, and quickens time to market. Additionally, digitalization enables companies to link visual configuration software with other platforms including e-commerce platforms, CRM, and enterprise resource planning (ERP). This interface offers efficient order processing, better collaboration, and smooth data interchange. Businesses can increase operational efficiency and get a competitive edge in the market by utilizing digital tools and technologies.

Global Visual Configuration Software Market Challenges:
The complexity of deployment and integration with existing systems is one of the biggest issues the worldwide visual configuration software market is now facing. Implementing visual configuration software entails several technical considerations, such as integrating the program with the business's current infrastructure, which may include e-commerce, CRM, and ERP platforms. It may be a difficult process that calls for system integration and modification knowledge. Compatibility concerns, data synchronization issues, and the necessity for customization to meet particular business requirements can all cause integration obstacles. Employee opposition to the new software and workflows may also arise throughout the installation phase, which is a challenge for firms. To guarantee a smooth and successful adoption of visual configuration, various implementation and integration obstacles must be overcome. This involves careful preparation, communication among stakeholders, and dedicated resources.
Global Visual Configuration Software Market Opportunities:
The expansion into developing industries is a key opportunity in the worldwide visual configuration software market. Although industries like automotive, furniture, and fashion have seen growth in the use of visual configuration software, there are still many other fields that could benefit. Visual configuration software companies have untapped potential to meet the rising need for individualized and customized products in emerging markets including healthcare, consumer electronics, and home appliances, hence broadening their customer base and fostering further growth.
COVID-19 Impact on Global Visual Configuration Software Market:
Many firms' journeys toward digital transformation have been expedited by the COVID-19 epidemic. Companies have resorted to visual configuration software to offer virtual product modification experiences to their clients due to lockdowns and limitations on physical interactions. As a result, businesses have adopted visual configuration software more frequently as they try to contact customers virtually and retain sales throughout the epidemic. On the other hand, the pandemic has also disrupted production processes and supply networks, delaying product introductions and reducing demand for visual configuration software in several sectors. Additionally, investment decisions have been hampered by financial limitations and economic uncertainty brought on by the epidemic, which has somewhat impacted market growth.
Global Visual Configuration Software Market Recent Developments:
- In November 2021, PwC Germany and Configit, the industry pioneer in Configuration Lifecycle Management (CLM), partnered strategically. By combining Configit's technologies with PwC's knowledge of digital operations, the partnership hopes to accelerate global manufacturers' digital transformation. It is anticipated that this partnership will provide manufacturers all around the world with full digital transformation solutions.
- In May 2021, the technical leader in Configure Price Quote (CPQ) and visualization software, KBMax, has been acquired by Epicor, a top supplier of corporate software tailored to certain industries. The agreement, which was finalized on May 27, intends to help clients make wiser sales and spur company expansion. The productivity toolkit from Epicor will incorporate KBMax's software solutions, which will provide a highly adaptable industry-specific module. This action fits with Epicor's goal of differentiating itself from generic ERP solutions by offering solutions that connect the front and back of the house.
VISUAL CONFIGURATION SOFTWARE MARKET REPORT COVERAGE:
|
REPORT METRIC
|
DETAILS
|
|
Market Size Available
|
2022 - 2030
|
|
Base Year
|
2022
|
|
Forecast Period
|
2023 - 2030
|
|
CAGR
|
8.2%
|
|
Segments Covered
|
By Type, Industrial Vertical , Application, and Region
|
|
Various Analyses Covered
|
Global, Regional & Country Level Analysis, Segment-Level Analysis, DROC, PESTLE Analysis, Porter’s Five Forces Analysis, Competitive Landscape, Analyst Overview on Investment Opportunities
|
|
Regional Scope
|
North America, Europe, APAC, Latin America, Middle East & Africa
|
|
Key Companies Profiled
|
Configit, KBMax, Axonom, Atlatl Software, ThreeKit, Infor, Marxent
|
Global Visual Configuration Software Market Segmentation:
Global Visual Configuration Software Market Segmentation: By Type
The market for visual configuration software can be divided into on-premises and cloud-based solutions based on type. Scalability, accessibility, and cost-effectiveness are benefits of cloud-based visual configuration software because it is hosted on remote servers and accessed online. The cloud-based sector is expanding significantly as a result of its adaptability and deployment simplicity. On-site visual configuration software, on the other hand, is set up and run on local servers, giving organizations greater control and protection over their data. Although on-premises solutions currently account for a sizable portion of the market, the trend toward cloud-based solutions is anticipated to persist due to the growing use of cloud technologies. Depending on parameters including firm size, industry vertical, and security needs, the market share for each segment varies, but cloud-based visual configuration software is picking up steam and snatching up a bigger chunk of the pie.
Global Visual Configuration Software Market Segmentation: By Industry Vertical
- Manufacturing
- Retail
- Healthcare
- IT & Telecom
- BFSI
- Education
- Government
- Others
Manufacturing, retail, healthcare, IT & telecom, BFSI, education, government, and others are the industry verticals into which the global market for visual configuration software may be divided. The necessity for faster setup procedures and the demand for product customization has given the manufacturing industry a sizable market share. Another significant industry is retail, where the use of visual configuration software helps to customize shopping experiences for customers. Visual configuration software assists in creating specialized medical equipment and devices for the healthcare sector. Visual configuration software is useful for setting sophisticated network solutions in the IT and telecom industries. Visual configuration software is used in the BFSI industry for individualized financial planning and investment possibilities. Visual configuration software is used in the education sector to create virtual learning environments. Visual configuration software is used by the public sector to plan public buildings and infrastructure. Manufacturing and retail are the main industries pushing the adoption of visual configuration software, while market share varies by industry.
Global Visual Configuration Software Market Segmentation: By Application
By application, the visual configuration software market can be divided into large and small businesses. Due to their larger resources and greater demand for complicated configuration processes, large organizations have historically been the main consumers of visual configuration software. These businesses use visual configuration software to improve the customer experience, expand their product offers, and speed up the sales process. A rising number of affordable and user-friendly solutions made specifically for smaller organizations are encouraging the adoption of visual configuration software among SMEs as well. To offer specialized goods and services, SMEs are realizing the advantages of visual configuration software across a variety of industries, including e-commerce, manufacturing, and retail. The visual configuration software industry is likely to develop in the future years, even though large organizations still account for a significant portion of the market.
Global Visual Configuration Software Market Segmentation: By Region
- North America
- Europe
- Asia Pacific
- South America
- Middle East & Africa
North America, Europe, Asia Pacific, South America, and the Middle East & Africa are the regions into which the global market for visual configuration software can be divided. Due to the widespread use of visual configuration software in sectors including manufacturing, retail, and automotive, North America maintains a substantial market share. Due to the existence of major manufacturers and the rising desire for personalized items in industries like fashion and furnishings, Europe also holds a sizeable market share. The market for visual configuration software is expanding quickly in the Asia Pacific area, driven by the booming e-commerce industry and the increasing focus on providing individualized consumer experiences. Although South America and the Middle East & Africa have comparatively lesser market shares, visual configuration software is increasingly being used in industries consisting of healthcare and IT & telecom. The Asia Pacific area is anticipated to experience considerable growth as the global market continues to change, led by rising economies and expanding digitalization initiatives.
Global Visual Configuration Software Market Key Players:
- Configit
- KBMax
- Axonom
- Atlatl Software
- ThreeKit
- Infor
- Marxent


