Visual Analytics Market Size (2024-2030)
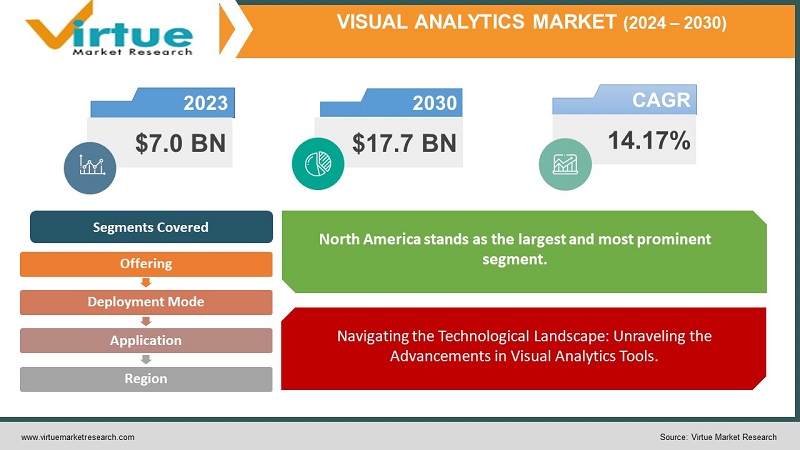
The Global Visual Analytics Market was valued at USD 7.0 Billion and is projected to reach a market size of USD 17.7 Billion by the end of 2030. Over the forecast period of 2024-2030, the market is projected to grow at a CAGR of 14.17%.
The Visual Analytics Market has been witnessing robust growth, propelled by the escalating volumes of big data and the growing complexity of datasets across industries. With organizations increasingly embracing business intelligence tools, visual analytics has become integral in facilitating interactive data exploration and decision-making through immersive dashboards and reports. Moreover, ongoing advancements in data visualization techniques continue to enhance the effectiveness of these tools, allowing businesses to derive meaningful insights from their data and navigate the intricate landscape of modern analytics.
Key Market Insights:
The global visual analytics market is anticipated to reach an impressive $17.7 billion by 2030, with a notable CAGR of 14.17% from 2024 to 2030. This substantial growth is attributed to the escalating volume and complexity of data, where visual analytics tools serve as a pivotal solution by simplifying data visualization and expediting the extraction of actionable insights. Additionally, rapid technological advancements in artificial intelligence (AI), machine learning (ML), and natural language processing (NLP) are transforming visual analytics tools, allowing for automated data analysis and predictive insights generation.
The global visual analytics market is on a significant upswing, driven by the widespread adoption of cloud-based solutions. The projected Compound Annual Growth Rate (CAGR) for the cloud segment in visual analytics is substantial at 23.5% from 2023 to 2033, surpassing that of the on-premises segment. This growth is attributed to the scalability of cloud solutions, enabling organizations to adjust resources flexibly without the need for costly upgrades.
In the dynamic landscape of visual analytics, SAP holds a significant market share of 12.1%, generating a profit of 4.8 billion dollars. In a strategic move, SAP announced in July 2023 the integration of its visual analytics platform, SAP Analytics Cloud, with its ERP system, SAP S/4HANA Cloud. Meanwhile, Sisense, with a 10.0% market share and a profit of 4.0 billion dollars, made waves in June 2023 with the launch of its Sisense Fusion Platform. This innovative cloud-based visual analytics platform goes beyond conventional data visualization, incorporating data preparation and governance capabilities.

Visual Analytics Market Drivers:
Addressing the Global Challenge of the Increasing Volume and Complexity of Data.
In the contemporary era, marked by the rapid proliferation of the Internet of Things (IoT), the ubiquitous influence of social media, and the pervasive integration of various digital technologies, there has been an extraordinary surge in the volume of data generated on a global scale. This exponential growth, characterized by its sheer magnitude and the inherent complexity of unstructured data, presents a formidable challenge to conventional analytical methods. As the data landscape becomes increasingly intricate, the limitations of traditional approaches are underscored. In response to this, visual analytics emerges as an indispensable tool, offering a systematic and visually intuitive means to decipher this complexity and present data in a manner that is not only comprehensible but also insightful, facilitating a more profound understanding of patterns and trends.
Navigating the Technological Landscape: Unraveling the Advancements in Visual Analytics Tools.
The unfolding narrative of technological progress, particularly in the realms of artificial intelligence (AI), machine learning (ML), and natural language processing (NLP), has ushered in a new era for visual analytics tools. These tools, once rudimentary, are now undergoing a paradigm shift, becoming increasingly sophisticated and user-friendly. The confluence of AI, ML, and NLP in the realm of visual analytics is transformative, automating pivotal tasks such as data preparation and cleaning. Beyond mere automation, these technological advancements empower visual analytics tools to delve into intricate data landscapes, unraveling insights that may elude human analysts. In essence, the evolution of technology is instrumental in enhancing the capabilities and efficiency of visual analytics tools, redefining their role in data analysis.
Meeting the Imperative: The Growing Demand for Real-time Data Analysis in Today's Business Landscape.
In the relentless rhythm of the contemporary business environment, where agility and informed decision-making are paramount, there exists an escalating demand for the capability to derive insights from real-time data. Visual analytics, with its dynamic and responsive nature, emerges as a pivotal player in fulfilling this imperative. By providing insights that are not static but continually updated as the data landscape evolves, visual analytics becomes an indispensable asset for organizations seeking to make decisions based on the latest, most relevant information. This responsiveness ensures that decision-makers are equipped with a real-time understanding of their data, empowering them to navigate the fast-paced and dynamic business landscape with agility and precision.
Democratizing Access: The Role of Cloud Computing in Making Visual Analytics Accessible and Affordable.
The ascent of cloud computing signifies a monumental shift in the accessibility and affordability of visual analytics tools for businesses of all sizes. Cloud-based visual analytics tools transcend geographical boundaries, offering a flexible solution that can be accessed seamlessly from any location with an internet connection. Beyond mere accessibility, the scalability inherent in cloud computing allows organizations to dynamically adjust resources based on their specific needs. This flexibility ensures optimal performance without the constraints imposed by traditional infrastructure, presenting a paradigm shift in how businesses can harness the power of visual analytics in a cost-effective and scalable manner.
Visual Analytics Market Restraints and Challenges:
Data Quality and Security Concerns: Navigating Complex Challenges in Visual Analytics Adoption.
In the dynamic landscape of visual analytics, the substantial growth in the market is accompanied by formidable challenges, and chief among them is the intricate issue of data quality and security. The efficacy of visualizing complex data hinges on the availability of high-quality, reliable data. However, ensuring the accuracy and consistency of data across diverse sources poses a significant hurdle. Challenges such as inconsistent formats, missing values, and the prevalence of duplicate entries can impede the creation of meaningful visualizations, potentially leading to inaccurate insights. Furthermore, the paramount concern of security risks looms large, especially when dealing with sensitive data. The consequences of breaches or unauthorized access can be severe, underscoring the critical importance of robust data security protocols and meticulous user access controls in the realm of visual analytics.
Lack of Skilled Workforce: Bridging the Talent Gap in Visual Analytics Implementation.
While the growth trajectory of the Visual Analytics market is impressive, a notable constraint hindering its wider adoption is the scarcity of a skilled workforce. The intricate nature of extracting meaningful insights from visual analytics demands a unique combination of skills in data analysis, interpretation, and effective communication. Unfortunately, there exists a significant gap in the availability of professionals who possess these amalgamated abilities. This shortage of skilled individuals can potentially limit the effectiveness of visual analytics implementations, emphasizing the urgent need for initiatives focused on bridging the talent gap and cultivating a workforce equipped to maximize the potential of visual analytics tools.
Integration with Legacy Systems: Overcoming Complexities in Modernizing Data Infrastructure for Visual Analytics.
In the pursuit of leveraging visual analytics tools for insightful data analysis, organizations often encounter a substantial challenge in the integration of these modern tools with legacy systems. Many entities heavily rely on legacy systems for data storage and management, and harmonizing these siloed systems with contemporary visual analytics tools becomes a formidable task. The integration process is not only challenging but can also be financially burdensome. Issues such as incompatibility, complex data pipelines, and lengthy development cycles can impede progress, hindering the seamless adoption of visual analytics tools. Navigating these complexities necessitates a strategic approach to modernizing data infrastructure while preserving the functionality of existing legacy systems.
Visual Analytics Market Opportunities:
Democratization of Data Insights: Empowering Organizations through User-Friendly Analytics Platforms.
In the realm of data analytics, the democratization of insights emerges as a transformative force, driven by user-friendly interfaces and intuitive dashboards. These tools empower non-technical users within organizations, fostering a culture that thrives on data-driven decision-making. As artificial intelligence (AI) continues to evolve, its integration into analytics platforms promises to automate routine tasks, freeing up data analysts for more strategic endeavors. The result is widespread accessibility to valuable insights, transforming data analysis from a specialized skill to an inclusive capability. Moreover, the art of interactive storytelling, facilitated by visualizations, enhances communication by captivating diverse stakeholders and effectively conveying complex insights.
Industry-Specific Solutions: Tailoring Visual Analytics for Precision in Healthcare, Finance, and Manufacturing.
The landscape of visual analytics is evolving towards industry-specific solutions, offering tailored dashboards and visualizations catering to the unique needs of sectors such as healthcare, finance, and manufacturing. This specialization unveils hidden patterns and optimizes decision-making processes within these industries. The integration of predictive analytics and anomaly detection not only facilitates proactive risk management but also enhances resource allocation, ultimately boosting operational efficiency. Real-time data analysis becomes a powerful ally, enabling businesses to adapt swiftly to market shifts and changing customer behaviors. The result is a competitive edge achieved through precision and agility in decision-making.
Integration and Interoperability: Building Cohesive Data Environments for Comprehensive Analysis.
The future of visual analytics hinges on seamless integration and interoperability, envisioning a landscape devoid of data silos. Visual analytics platforms that seamlessly integrate with existing data ecosystems create a holistic view for comprehensive analysis. The advent of open APIs and standardized data formats fosters collaboration and innovation within the visual analytics community. This collaborative spirit ensures that the field continues to evolve and adapt to the ever-changing data landscape. Furthermore, the prevalence of cloud-based solutions enhances scalability, flexibility, and accessibility, making visual analytics a viable and adaptive option for businesses of all sizes. The integration and interoperability paradigm represent a pivotal shift toward a cohesive and dynamic approach to data analysis.
VISUAL ANALYTICS MARKET REPORT COVERAGE:
|
REPORT METRIC
|
DETAILS
|
|
Market Size Available
|
2023 - 2030
|
|
Base Year
|
2023
|
|
Forecast Period
|
2024 - 2030
|
|
CAGR
|
14.17%
|
|
Segments Covered
|
By Offering, Deployment Mode, Application, and Region
|
|
Various Analyses Covered
|
Global, Regional & Country Level Analysis, Segment-Level Analysis, DROC, PESTLE Analysis, Porter’s Five Forces Analysis, Competitive Landscape, Analyst Overview on Investment Opportunities
|
|
Regional Scope
|
North America, Europe, APAC, Latin America, Middle East & Africa
|
|
Key Companies Profiled
|
Microsoft, Tableau, Qlik, Domo, Looker, ThoughtSpot, Sisense, TIBCO Software, IBM, SAS Institute
|
Visual Analytics Market Segmentation:
Visual Analytics Market Segmentation: By Offering
- Software
- Services
- Cloud-based Platforms
In the competitive landscape of technology solutions, the largest player in this segment is undeniably software. Software solutions dominate the market, providing a diverse array of tools and applications that cater to various needs within different industries. The prevalence of software solutions underscores their versatility and adaptability, offering users a wide range of functionalities for data analysis, visualization, and interpretation.
However, as the technological landscape continues to evolve, cloud-based platforms emerge as the fastest-growing segment during the forecast period. The advent of cloud computing has revolutionized the way businesses access, store, and analyze data. Cloud-based platforms offer unparalleled scalability, flexibility, and accessibility, making them increasingly popular among organizations of all sizes. The forecasted growth of cloud-based platforms signifies a shift towards more dynamic and agile solutions, allowing businesses to harness the power of visual analytics with enhanced efficiency and adaptability. The emphasis on cloud-based platforms aligns with the broader trend of digital transformation, emphasizing the importance of innovation and scalability in the ever-evolving technological landscape.
Visual Analytics Market Segmentation: By Deployment Mode
- On-premise
- Cloud-based
- Hybrid
Within the realm of deployment models, the largest player in this segment is undeniably the on-premise model. Traditionally, organizations have heavily invested in establishing on-premise infrastructure to host and manage their software applications and data. This deployment model offers a sense of control and security, as organizations retain ownership and oversight of their hardware and software resources. Despite the growth of alternative models, on-premise deployment remains prevalent, particularly in industries where data security and compliance are paramount.
However, the fastest-growing deployment model during the forecast period is undoubtedly the cloud-based model. The rise of cloud computing has revolutionized the way businesses approach IT infrastructure. Cloud-based deployment provides unparalleled scalability, flexibility, and cost-effectiveness. Organizations are increasingly drawn to the agility and efficiency offered by cloud solutions, enabling them to access resources and deploy applications with unprecedented speed. The forecasted growth of cloud-based deployment underscores a shift towards more dynamic, adaptable, and scalable solutions, aligning with the broader trend of digital transformation in the contemporary technological landscape. This trend signifies a recognition of the benefits of cloud-based deployment, ranging from reduced capital expenditures to improved accessibility and collaboration.
Visual Analytics Market Segmentation: By Application
- Business Intelligence (BI)
- Customer Analytics
- Financial Analytics
- Marketing Analytics
- Operational Analytics
In the diverse landscape of visual analytics applications, the largest segment is unquestionably Business Intelligence (BI). Business Intelligence plays a pivotal role in organizations, offering a comprehensive suite of tools and processes that enable the collection, analysis, and presentation of business information. BI applications empower decision-makers with insights derived from data, fostering informed and strategic decision-making across various facets of the business. The prevalence of BI applications underscores their critical role in enhancing operational efficiency and driving organizational success.
However, as the technological landscape evolves, the fastest-growing application segment during the forecast period is identified as Customer Analytics. Recognizing the paramount importance of understanding customer behavior and preferences, businesses are increasingly turning to customer analytics applications to gain actionable insights. This application focuses on analyzing customer data to uncover patterns, trends, and correlations that can inform personalized marketing strategies, improve customer experiences, and drive customer retention. The forecasted growth of customer analytics applications reflects the strategic shift towards a more customer-centric approach in the business landscape, emphasizing the significance of leveraging data to enhance customer relationships and drive sustainable growth.

Visual Analytics Market Segmentation: By Region:
- North America
- Asia-Pacific
- Europe
- South America
- Middle East and Africa
Within the global landscape of visual analytics adoption, North America stands as the largest and most prominent segment. The region has consistently been at the forefront of technological innovation and digital transformation. With a robust infrastructure, a thriving business environment, and a high degree of technological adoption, North America has emerged as a hub for the widespread utilization of visual analytics tools. The prevalence of advanced industries, a strong emphasis on data-driven decision-making, and a mature market contribute to North America's leadership in the visual analytics segment.
However, as we look toward the forecasted period, the fastest-growing segment is anticipated to be Asia-Pacific. The dynamic economies within the Asia-Pacific region, coupled with a rapidly expanding technological landscape, position it as a hotspot for accelerated growth in visual analytics adoption. The forecasted surge in Asia-Pacific is driven by factors such as increasing digitalization, a growing number of businesses embracing analytics for strategic decision-making, and the continuous rise of innovative startups. As organizations across Asia-Pacific recognize the transformative potential of visual analytics, the region is poised to experience substantial growth, reflecting a shift in the global visual analytics landscape toward greater diversity and inclusion.
COVID-19 Impact Analysis on the Global Visual Analytics Market:
The COVID-19 pandemic fueled a heightened demand for data-driven insights, leading businesses to adopt visual analytics solutions for navigating uncertainties and making informed decisions. The shift to remote work environments boosted the use of cloud-based visual analytics platforms, enabling collaborative and real-time data analysis. Specific industries, including healthcare, finance, and retail, experienced increased demand for visual analytics to address unique challenges. The pandemic also accelerated the trend of self-service analytics, allowing non-technical users to explore and analyze data independently, facilitating faster decision-making.
However, the pandemic posed challenges, with disruptions in supply chains affecting the availability and affordability of visual analytics tools. Economic downturns prompted businesses to reassess budgets, resulting in the exploration of cheaper alternatives or delayed investments in advanced solutions. The rapid shift to remote work raised data security concerns, emphasizing the need for ensuring data quality and compliance. Additionally, the talent gap in data skills became more pronounced, hindering the full potential of visual analytics solutions as businesses struggled to find skilled professionals for effective tool utilization and interpretation.
Latest Trends/Developments:
- Microsoft's acquisition of Tableau for $12.5 billion in July 2023 has reshaped the Visual Analytics market, boosting Microsoft's share from 1.8% to 4.6% in 2030 projections. This move solidifies Microsoft as a key player challenging Tableau's dominance. Projections now estimate Microsoft capturing 19% of the market by 2030, narrowing the gap with Tableau's projected 22% share. The acquisition prompts further consolidation in the market, fostering innovation and emphasizing user experience. This development sets the stage for a more competitive Visual Analytics landscape, benefitting users with increased choice, innovation, and easier access to data insights.
- Google AI's launch of AutoML for Visual Insights on October 26, 2023, marks a significant advancement in the realm of visual analytics. This innovative tool is designed to democratize the field by enabling automatic generation of insights from data without the need for coding. The impact of this development is profound as it opens up the world of visual analytics to non-technical users, allowing them to harness the power of data insights without specialized programming skills.
Key Players:
- Microsoft
- Tableau
- Qlik
- Domo
- Looker
- ThoughtSpot
- Sisense
- TIBCO Software
- IBM
- SAS Institute
Microsoft and Tableau stand as the two dominant players in the Visual Analytics market, each with its own strengths and target audience. Microsoft, with its powerful cloud and AI offerings, caters to businesses seeking a comprehensive data analytics platform. Tableau, renowned for its user-friendly interface and self-service capabilities, attracts those prioritizing ease of use and data democratization. Their strategic acquisition in 2023 further intensifies the competition and shapes the future of visual analytics.


