
Renewable Natural Gas Market Research Report – Segmentation by Source / Feedstock (Landfill Gas, Agricultural Waste, Wastewater Treatment Plants, Food Waste & Municipal Solid Waste (MSW), Others); By Application (Vehicle Fuel, Power Generation / Electricity, Heating / Thermal, Pipeline Injection / Gas Grid, Others); By Distribution Channel (Supermarkets / Hypermarkets, Online Retail, Specialty Stores, Pharmacies); By Production Technology (Anaerobic Digestion, Syngas Gasification + Methanation, Biogas Upgrading Technologies); By End‑User / Sector (Residential, Commercial, Industrial, Utilities, Transportation Fleets); and Region - Size, Share, Growth Analysis | Forecast (2025– 2030)
Renewable Natural Gas Market Size (2025-2030)
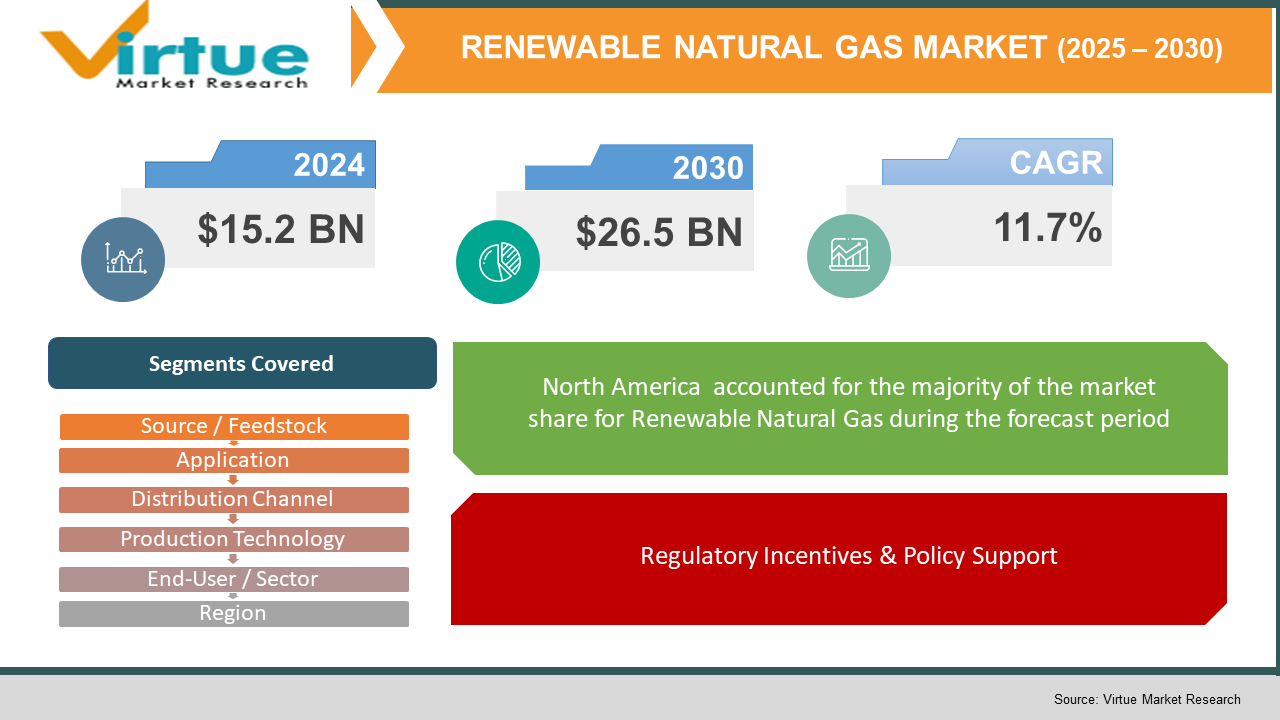
The Renewable Natural Gas Market was valued at $15.2 billion and is projected to reach a market size of $26.5 billion by the end of 2030. Over the forecast period of 2025-2030, the market is projected to grow at a CAGR of 11.7%
Renewable Natural Gas (RNG) is a cleaner alternative to regular natural gas. It's made by refining biogas from organic waste like food scraps, farm leftovers, green waste, and even sludge from wastewater. Since it’s chemically the same as fossil gas, RNG can easily fit into the current gas systems and can be used for things like making electricity, heating, and fueling vehicles (like compressed natural gas or liquefied natural gas). The ways to make RNG include collecting biogas from landfills, using livestock manure, and processing wastewater. For example, gas from landfills is captured and cleaned up, while farms digest animal waste, and treatment plants turn sludge into gas. These methods not only provide renewable energy but also help cut down on methane emissions. The RNG market is divided by how it's produced—like from landfills, livestock, or wastewater—and by how it’s used. RNG can be found at local fueling stations or added directly to the gas supply, making it a handy energy source. It also supports a circular economy by turning waste into fuel, which helps with sustainability goals. The market includes big energy companies, waste management firms, and new companies focusing on RNG development. There are many partnerships and investments happening to boost RNG capabilities. As RNG becomes more accepted in transport, residential, commercial, and industrial sectors, it’s proving to be a sustainable, low-carbon energy option that meets the need for cleaner alternatives without needing a lot of new infrastructure.
Key Market Insights:
RNG is becoming an important way to cut down on methane emissions and make use of organic waste. The University of California says that over 20% of California's residential natural gas needs could be met by RNG from organic waste. This really shows the potential of recycling waste in crowded areas.
RNG comes from various sources like landfills, animal waste, and sludge from wastewater treatment. Landfills are a big player, making up about 35% of the RNG supply in the U.S. As of September 2021, there were 548 landfill gas projects up and running, according to the U.S. EPA. Farmers are also turning to biogas systems for managing manure while producing RNG.
Today, RNG is used for transportation, electricity, and heating, with transportation growing rapidly. More than 60% of RNG in the transportation sector is used as vehicle fuel, often as compressed or liquefied natural gas. This fuels public transit, freight, and municipal fleets through existing CNG/LNG systems.
About 40% of active RNG projects in North America involve partnerships between energy companies, local governments, and waste management firms. These collaborations help make RNG production scalable and allow for better integration into utility pipelines.
Government policies have recognized RNG as an advanced biofuel, which has encouraged its growth. When RNG is used as a fuel for transportation, it can cut carbon emissions by up to 90% compared to diesel, making it one of the cleanest fuel options available today.

Renewable Natural Gas Market Key Drivers:
Regulatory Incentives & Policy Support.
Around the globe, governments are adopting supportive policies to encourage the production of renewable natural gas (RNG). For instance, in the U.S., the Renewable Fuel Standard (RFS) and renewable energy credits help create a better business environment for RNG by providing tax cuts, grants, and carbon pricing. These measures are designed to make producing RNG a more attractive option for businesses, ultimately boosting the market.
Climate Action & Waste Management Alignment.
RNG plays an important role in turning methane, which is a potent greenhouse gas, into usable energy. This process takes advantage of waste from landfills, farm residues, and even wastewater. By capturing and repurposing this methane, we can not only reduce harmful emissions but also work towards a more circular economy, where waste is reused and turned into something valuable. It’s a win-win for the environment and energy production.
Production Technology Breakthroughs.
There have been some exciting advances in the technology used to produce RNG. Techniques like anaerobic digestion, membrane separation, and gas purification are becoming more efficient and cost-effective. These innovations are helping to lower the overall costs of producing RNG and improving the purity of the gas itself. As a result, RNG is becoming a more competitive option compared to traditional natural gas, opening up new possibilities in the energy market.
Renewable Natural Gas Market Restraints and Challenges:
Challenges for Renewable Natural Gas (RNG) Growth.
Even though Renewable Natural Gas (RNG) has a lot of potential for helping the environment, it faces several tough challenges that make it hard to grow and attract users. One big issue is the high initial costs needed to set up and keep up the infrastructure for RNG, like digesters and upgrading systems. These expenses can be higher than traditional natural gas, making it tough for RNG to compete on price without support from policies. Another problem is the inconsistent access to organic sources like landfill gas, manure, and sludge, which are needed in large amounts for RNG to work commercially. Collecting and processing these materials from different places adds complexity and costs. Infrastructure issues are also critical—many gas pipelines are not set up for RNG, and improving these systems can take a lot of time and money. On top of that, the confusing mix of regulations in different areas creates uncertainty for investors since incentive programs and rules can be very different from one place to another. This inconsistency makes it hard to push projects through and can scare off long-term investors. There’s also increased competition from other clean energy options like hydrogen, solar, and wind, which are often easier to understand and receive more support. Public knowledge about RNG is still pretty low, which doesn’t help either consumer interest or engagement from stakeholders. So, RNG has to tackle not just technical and financial obstacles, but also issues related to visibility and public perception to carve out its spot in the changing energy landscape. Tackling these challenges will need teamwork on innovation, infrastructure growth, and educating the public to make the most of RNG as a sustainable energy option.
Renewable Natural Gas Market Opportunities:
Opportunities in Transportation, Waste Management, and Infrastructure.
The Renewable Natural Gas (RNG) market is growing in a few key areas like transportation, waste management, and energy infrastructure. One of the main uses is as a low-carbon fuel for vehicles, especially heavy-duty trucks, city buses, and garbage trucks. RNG helps these vehicles meet strict emissions laws and supports clean energy goals. Cities and farms are also starting to see the benefits of turning organic waste—like food scraps and manure—into energy. This not only helps stabilize the RNG supply but also cuts down on methane emissions from landfills and creates local energy. For example, New York City is using a method that combines food waste with wastewater sludge to lower its fossil fuel use. Plus, RNG can easily be added to current natural gas systems without needing much change, which saves on costs. There are also new technologies like small modular RNG production units and virtual pipeline systems that make it easier to access RNG in more remote areas. All these trends in reducing transportation emissions, managing waste better, and fitting into existing infrastructure make RNG a practical option for moving towards cleaner energy while providing environmental and economic perks.
RENEWABLE NATURAL GAS MARKET REPORT COVERAGE:
|
REPORT METRIC |
DETAILS |
|
Market Size Available |
2024 - 2030 |
|
Base Year |
2024 |
|
Forecast Period |
2025 - 2030 |
|
CAGR |
11.7% |
|
Segments Covered |
By Source / Feedstock , Application , Distribution Channel , Production Technology , End‑User / Sector , and Region |
|
Various Analyses Covered |
Global, Regional & Country Level Analysis, Segment-Level Analysis, DROC, PESTLE Analysis, Porter’s Five Forces Analysis, Competitive Landscape, Analyst Overview on Investment Opportunities |
|
Regional Scope |
North America, Europe, APAC, Latin America, Middle East & Africa |
|
Key Companies Profiled |
Clean Energy Fuels Corp., Archaea Energy Inc., Montauk Renewables, Vanguard Renewables, VERBIO Vereinigte Bioenergie AG, BP plc, Chevron Corporation, Waste Management Inc., Air Liquide SA, ENERKEM Inc. |
Renewable Natural Gas Market Segmentation:
Renewable Natural Gas Market Segmentation: By Source / Feedstock
- Landfill Gas
- Agricultural Waste
- Wastewater Treatment Plants
- Food Waste & Municipal Solid Waste (MSW)
- Others
Food waste and municipal solid waste (MSW) are the fastest-growing types of feedstock right now. Cities want to keep organic waste out of landfills and make use of its energy. Urbanization is leading to more food scraps, which is pushing municipalities to invest in anaerobic digesters. Using MSW for renewable natural gas (RNG) helps solve waste issues and meet energy goals, making it a hot topic in the RNG market.
On the other hand, landfill gas still dominates, providing about 45% of the global RNG supply due to the large amounts of methane in landfills. The infrastructure for landfill RNG has been around for a long time, and it’s cost-effective to tap into these systems. Stable production and support from environmental rules keep landfill gas strong while new feedstocks grow.
Renewable Natural Gas Market Segmentation: By Application
- Vehicle Fuel
- Power Generation / Electricity
- Heating / Thermal
- Pipeline Injection / Gas Grid
- Others
The use of RNG as vehicle fuel, mainly as compressed or liquefied natural gas, is growing fast. In Europe and North America, strict emissions rules and low-carbon fuel standards are boosting adoption, especially in heavy-duty trucks and buses. About 25–36% of the biomethane market comes from automotive fuels, making it the fastest-growing area due to supportive policies and better awareness of environmental issues. The rise in public transit and commercial fleets is helping RNG become more common as a clean fuel.
While RNG is seeing rapid growth in vehicle fuel, most of its market share is still in power generation and pipeline injection. Upgraded biogas is often used in power plants or injected into natural gas grids for various uses. Power generation makes up around 35% of the biomethane market, being the largest segment. Also, the ability to inject RNG into gas grids without major changes has helped pipeline injection account for over 50% of the global market by value, making it easier for utilities and users to switch to cleaner energy.
Renewable Natural Gas Market Segmentation: By Distribution Channel
- Supermarkets / Hypermarkets
- Online Retail
- Specialty Stores
- Pharmacies
Online channels for energy distribution, like e-commerce platforms, are growing quickly, similar to how they've expanded for consumer goods. These platforms work well with digital models that provide RNG certificates and integrate into smart grid systems. Even though it's still early, online retail is helping new providers connect with customers directly and test out subscription options, attracting tech-savvy buyers. This growth trend is similar to the digital grocery market, which has seen about 20% growth in online sales. The online energy channel is expected to keep growing as smart utility models develop.
Meanwhile, traditional energy sales through supermarkets and convenience stores are still the main way RNG gets distributed. Large fuel retailers with convenience store setups and CNG/LNG stations near grocery stores see lots of foot traffic and offer integrated fuelling options. They dominate energy distribution in a way similar to supermarkets in food retail, benefiting from economies of scale. These big energy stations are key for fleet refueling, especially where RNG-injection networks exist, making them the leading channel for RNG distribution right now.
Renewable Natural Gas Market Segmentation: By Production Technology
- Anaerobic Digestion
- Syngas Gasification + Methanation
- Biogas Upgrading Technologies
Syngas gasification followed by methanation is a fast-growing technology for renewable natural gas (RNG). It turns dry biomass like wood, straw, and construction waste into syngas, which is then converted into pipeline-quality methane. Advances in gasification can achieve conversion efficiencies of up to 67%, and pilots on a large scale are already in progress. This method broadens the types of feedstock used and allows for easier and quicker deployment of RNG.
Anaerobic digestion (AD) is still the main way to produce RNG, making up about 90% of global biomethane output. It effectively processes wet organic materials such as manure, food waste, and sewage into biogas, which can be upgraded to high-quality RNG. Technologies for upgrading consistently achieve over 98% methane purity, making them suitable for gas grids. AD's established infrastructure and access to feedstock keep it the leading option in the RNG market.
Renewable Natural Gas Market Segmentation: By End‑User / Sector
- Residential
- Commercial
- Industrial
- Utilities
- Transportation Fleets
The rapid growth of RNG as a low-carbon fuel in transport, like buses and trucks, makes it the fastest-growing sector. Programs like the U.S. Renewable Fuel Standard and California’s Low Carbon Fuel Standard pushed RNG to make up about 84% of U.S. transportation use by 2022.
While transport is growing quickly, utilities and power generation still use the most RNG, especially for electricity and heating. Its easy use in gas grids and ability to balance renewable energy keep utilities the biggest consumers, ensuring its continued importance in the market.
Renewable Natural Gas Market Segmentation: By Region
- North America
- Europe
- Asia-Pacific
- Latin America
- Middle East and Africa

North America is expected to take the lead in the Renewable Natural Gas (RNG) market, holding about 38% of the share. This growth is thanks to supportive government policies, a solid gas infrastructure, and its use in transport and utilities. Europe isn't far behind with a 37% share, motivated by strict emissions goals and policies that encourage energy variety, especially in places like Germany and France where biomethane production is thriving. The Asia-Pacific region represents 15%, driven by rising investments in biogas projects in China, India, and Southeast Asia focused on rural energy and waste management. Latin America is around 7%, making strides with landfill gas recovery and agro-waste initiatives in Brazil and Mexico. The Middle East and Africa have a smaller share at 3%, but they’re starting to explore RNG with pilot projects in waste-to-energy and municipal biogas. This setup shows a worldwide move towards cleaner gas options, with developed and developing regions both playing a role in market growth.
COVID-19 Impact Analysis on the Renewable Natural Gas Market:
The COVID-19 pandemic had a mixed effect on the Renewable Natural Gas (RNG) market. At first, lockdowns around the world led to a drop in demand for transportation and industrial fuels, which caused a short-term dip in RNG use and made low-carbon fuel credits less valuable in some areas. Building new RNG facilities also faced delays because of equipment shortages and fewer workers available. Still, RNG held up better than other renewable sources, especially in the U.S., thanks to steady regulations and incentives like the Renewable Fuel Standard that kept demand stable for transportation. As the pandemic changed what energy priorities looked like, more governments and investors began to see RNG as an important way to cut carbon emissions in hard-to-decarbonize sectors. It works well with existing setups and helps reduce methane emissions from waste. After the pandemic, recovery plans began to focus on green energy investments, which gave RNG a boost. So, while the pandemic caused some bumps in the road, it also led to a greater understanding of RNG as a dependable and sustainable energy option for the future.
Trends/Developments:
In January 2025, there was a big push in policy and finance with the Renewable Natural Gas Incentive Act, which offered a $1 tax credit per gallon for renewable natural gas used in transportation. At the same time, hydrogen-RNG fueling infrastructure began to show real promise as a growth area.
Back in September 2024, Apollo-managed funds took over a majority of Freedom CNG, a major player in the CNG/RNG fueling business in Texas, helping to expand its network of eco-friendly fueling stations. Sagepoint Energy also bought two landfill-based RNG assets, Lynx and RPP, which added about 1 bcf of RNG production for the year.
In January 2024, Clean Energy Fuels launched its Drumgoon Dairy RNG facility in South Dakota, which can make 1.66 million gallons of negative-carbon RNG each year for use in transportation fuel. The RNG Coalition is looking forward to a strong year ahead, with new U.S. EPA biogas targets and significant private sector deals, including the largest open-market RNG agreement so far.
Key Players:
- Clean Energy Fuels Corp.
- Archaea Energy Inc.
- Montauk Renewables
- Vanguard Renewables
- VERBIO Vereinigte Bioenergie AG
- BP plc
- Chevron Corporation
- Waste Management Inc.
- Air Liquide SA
- ENERKEM Inc.
Chapter 1 RENEWABLE NATURAL GAS Market– Scope & Methodology
1.1. Market Segmentation
1.2. Scope, Assumptions & Limitations
1.3. Research Methodology
1.4. Primary Sources
1.5. Secondary Sources
Chapter 2 RENEWABLE NATURAL GAS Market – Executive Summary
2.1. Market Size & Forecast – (2024 – 2030) ($M/$Bn)
2.2. Key Trends & Insights
2.2.1. Demand Side
2.2.2. Supply Side
2.3. Attractive Investment Propositions
2.4. COVID-19 Impact Analysis
Chapter 3 RENEWABLE NATURAL GAS Market– Competition Scenario
3.1. Market Share Analysis & Company Benchmarking
3.2. Competitive Strategy & Development Scenario
3.3. Competitive Pricing Analysis
3.4. Supplier-Distributor Analysis
Chapter 4 RENEWABLE NATURAL GAS Market - Entry Scenario
4.1. Regulatory Scenario
4.2. Case Studies – Key Start-ups
4.3. Customer Analysis
4.4. PESTLE Analysis
4.5. Porters Five Force Model
4.5.1. Bargaining Power of Suppliers
4.5.2. Bargaining Powers of Customers
4.5.3. Threat of New Entrants
4.5.4. Rivalry among Existing Players
4.5.5. Threat of Substitutes
Chapter 5 RENEWABLE NATURAL GAS Market- Landscape
5.1. Value Chain Analysis – Key Stakeholders Impact Analysis
5.2. Market Drivers
5.3. Market Restraints/Challenges
5.4. Market Opportunities
Chapter 6 RENEWABLE NATURAL GAS Market – By Source / Feedstock
6.1 Introduction/Key Findings
6.2 Landfill Gas
6.3 Agricultural Waste
6.4 Wastewater Treatment Plants
6.5 Food Waste & Municipal Solid Waste (MSW)
6.6 Others
6.7 Y-O-Y Growth trend Analysis By Source / Feedstock
6.8 Absolute $ Opportunity Analysis By Property Type, 2025-2030
Chapter 7 RENEWABLE NATURAL GAS Market – By Distribution Channel
7.1 Introduction/Key Findings
7.2 Supermarkets / Hypermarkets
7.3 Online Retail
7.4 Specialty Stores
7.5 Pharmacies
7.6 Y-O-Y Growth trend Analysis By Distribution Channel
7.7 Absolute $ Opportunity Analysis By Distribution Channel , 2025-2030
Chapter 8 RENEWABLE NATURAL GAS Market – By Application
8.1 Introduction/Key Findings
8.2 Vehicle Fuel
8.3 Power Generation / Electricity
8.4 Heating / Thermal
8.5 Pipeline Injection / Gas Grid
8.6 Others
8.7 Y-O-Y Growth trend Analysis Application
8.8 Absolute $ Opportunity Analysis Application, 2025-2030
Chapter 9 RENEWABLE NATURAL GAS Market – By Production Technology
9.1 Introduction/Key Findings
9.2 Anaerobic Digestion
9.3 Syngas Gasification + Methanation
9.4 Biogas Upgrading Technologies
9.5 Y-O-Y Growth trend Analysis Production Technology
9.6 Absolute $ Opportunity Analysis Production Technology , 2025-2030
Chapter 10 RENEWABLE NATURAL GAS Market – By End-User
10.1 Introduction/Key Findings
10.2 Residential
10.3 Commercial
10.4 Industrial
10.5 Utilities
10.6 Transportation Fleets
10.7 Y-O-Y Growth trend End-User
10.8 Absolute $ Opportunity End-User , 2025-2030
Chapter 11 RENEWABLE NATURAL GAS Market, By Geography – Market Size, Forecast, Trends & Insights
11.1. North America
11.1.1. By Country
11.1.1.1. U.S.A.
11.1.1.2. Canada
11.1.1.3. Mexico
11.1.2. By Source / Feedstock
11.1.3. By Production Technology
11.1.4. By Application
11.1.5. Distribution Channel
11.1.6. End‑User Type
11.1.7. Countries & Segments - Market Attractiveness Analysis
11.2. Europe
11.2.1. By Country
11.2.1.1. U.K.
11.2.1.2. Germany
11.2.1.3. France
11.2.1.4. Italy
11.2.1.5. Spain
11.2.1.6. Rest of Europe
11.2.2. By Source / Feedstock
11.2.3. By Production Technology
11.2.4. By Application
11.2.5. Distribution Channel
11.2.6. End‑User Type
11.2.7. Countries & Segments - Market Attractiveness Analysis
11.3. Asia Pacific
11.3.1. By Country
11.3.1.2. China
11.3.1.2. Japan
11.3.1.3. South Korea
11.3.1.4. India
11.3.1.5. Australia & New Zealand
11.3.1.6. Rest of Asia-Pacific
11.3.2. By Source / Feedstock
11.3.3. By Production Technology
11.3.4. By Application
11.3.5. Distribution Channel
11.3.6. End‑User Type
11.3.7. Countries & Segments - Market Attractiveness Analysis
11.4. South America
11.4.1. By Country
11.4.1.1. Brazil
11.4.1.2. Argentina
11.4.1.3. Colombia
11.4.1.4. Chile
11.4.1.5. Rest of South America
11.4.2. By Source / Feedstock
11.4.3. By Production Technology
11.4.4. By Application
11.4.5. Distribution Channel
11.4.6. End‑User Type
11.4.7. Countries & Segments - Market Attractiveness Analysis
11.5. Middle East & Africa
11.5.1. By Country
11.5.1.1. United Arab Emirates (UAE)
11.5.1.2. Saudi Arabia
11.5.1.3. Qatar
11.5.1.4. Israel
11.5.1.5. South Africa
11.5.1.6. Nigeria
11.5.1.7. Kenya
11.5.1.11. Egypt
11.5.1.11. Rest of MEA
11.5.2. By Source / Feedstock
11.5.3. By Production Technology
11.5.4. By Application
11.5.5. Distribution Channel
11.5.6. End‑User Type
11.5.7. Countries & Segments - Market Attractiveness Analysis
Chapter 12 RENEWABLE NATURAL GAS Market – Company Profiles – (Overview, Source / Feedstock Portfolio, Financials, Strategies & Developments)
12.1 Clean Energy Fuels Corp.
12.2 Archaea Energy Inc.
12.3 Montauk Renewables
12.4 Vanguard Renewables
12.5 VERBIO Vereinigte Bioenergie AG
12.6 BP plc
12.7 Chevron Corporation
12.8 Waste Management Inc.
12.9 Air Liquide SA
12.10 ENERKEM Inc.
Download Sample
Choose License Type
2500
4250
5250
6900
Frequently Asked Questions
Support from regulations, goals for reducing emissions, and the need for diverse energy sources are key factors
Utilities, transport companies, and industrial sites are the main users.
It helps improve the use of feedstock, monitoring processes, and overall efficiency.
Europe and Asia-Pacific are leading in adopting RNG.
Trends include cross-border trading, modular plants, and making money from carbon credits.