Network Function Virtualization Market Size (2024 – 2030)
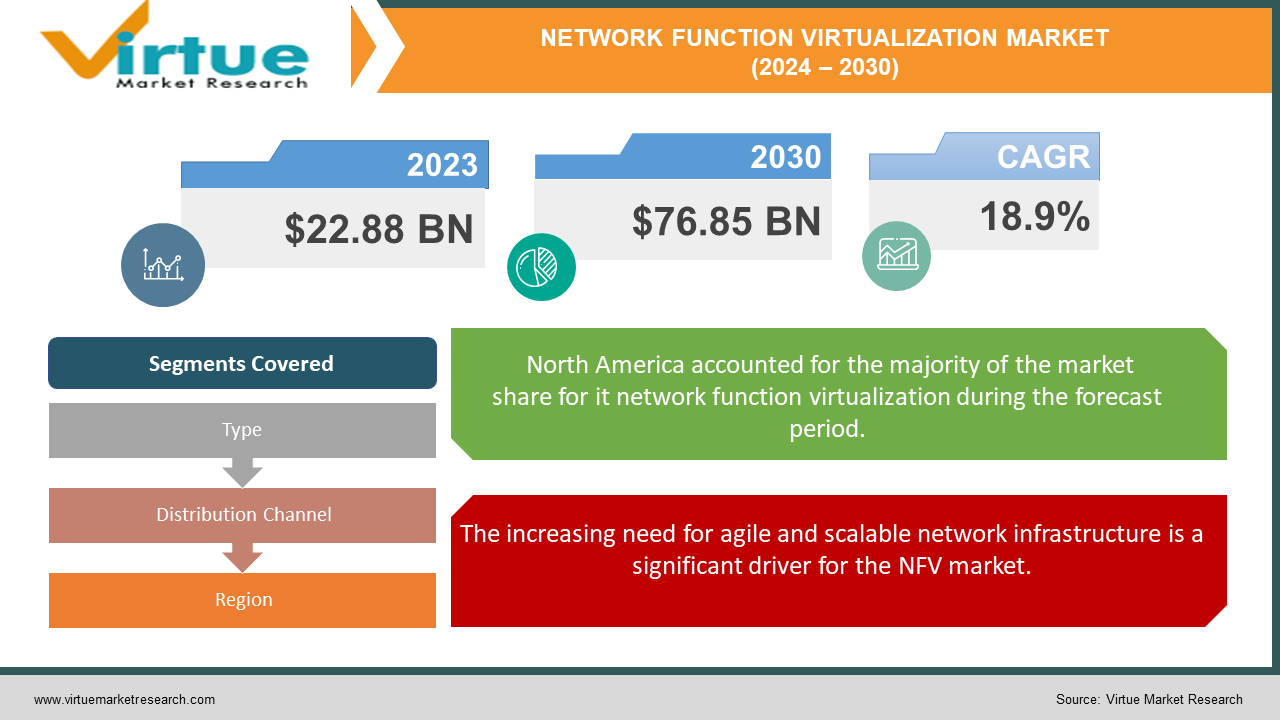
The Global Network Function Virtualization Market was valued at USD 22.88 Billion in 2023 and is projected to reach a market size of USD 76.85 Billion by the end of 2030. Over the forecast period of 2024-2030, the market is projected to grow at a CAGR of 18.9%.
Network Function Virtualization (NFV) is a revolutionary network architecture concept that aims to decouple network functions such as routing, firewalling, and load balancing from dedicated hardware appliances and run them as software on commodity hardware. This transformation is crucial for modernizing and optimizing network infrastructure, enhancing flexibility, and scalability, and reducing operational costs. Traditional network appliances are specialized hardware devices designed for specific network functions. NFV breaks this dependency by allowing these functions to be virtualized and executed on standard servers, storage, and switches. This decoupling enhances the flexibility and adaptability of network services. NFV promotes better utilization of hardware resources by dynamically allocating them based on real-time network demands. This approach leads to more efficient use of network infrastructure, reducing idle hardware and optimizing performance. NFV offers unparalleled scalability, enabling service providers to quickly scale up or down network functions based on demand. This flexibility is particularly beneficial in managing traffic spikes, rolling out new services, and adapting to changing customer needs.
Key Market Insights:
NFV deployment can cut service rollout time by 50%. 65% of global service providers use NFV for core networks.
NFV can lower capital expenditure by 25%. 90% of major telecoms report improved network agility with NFV.
NFV is expected to support 50 billion IoT devices by 2025. 40% of network operators report a 20% increase in service innovation due to NFV.
75% of telecom executives believe NFV is critical for 5G. The NFV market is projected to grow at 22% CAGR through 2027.
68% of service providers report enhanced network security with NFV. NFV solutions achieve a 35% reduction in energy consumption.
NFV improves network resource utilization by 40%. 85% of telecoms use NFV for network slicing in 5G.
NFV enhances service delivery speed by 45%. 60% of telecom operators see a 25% reduction in hardware dependency with NFV.
Network Function Virtualization Market Drivers:
The increasing need for agile and scalable network infrastructure is a significant driver for the NFV market.
Due to the necessity of managing enormous volumes of data traffic and offering a wide range of services, the telecoms industry is leading the way in the adoption of NFV. The increasing demand for cloud services, IoT devices, video streaming, and high-speed internet is beyond the capacity of traditional network infrastructure. Telecom operators may deliver new services more quickly, manage network resources more effectively, and launch new apps faster thanks to NFV. Businesses are depending more and more on digital transformation to remain competitive. With NFV, businesses can install and operate network services with greater flexibility and freedom from the limitations of physical hardware. Multinational corporations that have to guarantee constant and dependable network performance across many areas would especially benefit from this.
Advancements in virtualization and cloud technologies are propelling the NFV market forward. Virtualization technologies, such as hypervisors and containerization.
Because they enable several virtual machines (VMs) to operate on a single physical server, hypervisors are essential to network function virtualization (NFV). Different network services, including firewalling and routing, may be hosted by each virtual machine (VM), giving you the freedom to dynamically distribute resources. This method lowers the requirement for specialized hardware appliances while improving resource consumption. The development and deployment of network functions are changing as a result of containerization and microservices architecture. VNFs may operate in a lightweight, portable environment with containers, which facilitates their scaling and management. Network functions are divided into smaller, independent services by microservices, which may be independently created, deployed, and expanded. This modular strategy improves resilience and agility, enabling quick upgrades and fault separation.

Network Function Virtualization Market Restraints and Challenges:
VNFs from several manufacturers are deployed on a shared infrastructure as part of NFV. Because different vendors may have different standards and criteria, it can be difficult to ensure compatibility between VNFs and the underlying infrastructure. The integration process may become more difficult as a result of this lack of uniformity. Numerous establishments have made significant investments in conventional network equipment and systems. Careful preparation and execution are necessary when moving from these outdated systems to NFV. In addition to deploying new VNFs, it also entails integrating current services and apps into the virtualized environment. It may take a lot of time and resources to make this shift. VNFs must be secured against various threats, including malware, unauthorized access, and data breaches. This requires robust security measures, such as encryption, authentication, and intrusion detection systems. Ensuring the security of VNFs throughout their lifecycle, from deployment to decommissioning, is essential for maintaining a secure network environment. NFV environments are dynamic, with VNFs being deployed, scaled, and updated frequently. Implementing and enforcing dynamic security policies that adapt to these changes is challenging. Security policies must be automatically updated and applied to new VNFs, ensuring consistent security across the entire network
Network Function Virtualization Market Opportunities:
Emerging markets are witnessing a surge in mobile and internet penetration, driving the need for robust and scalable network infrastructure. Telecommunications operators in these regions are investing in NFV to enhance their network capabilities, offer new services, and improve customer experience. NFV enables them to quickly deploy and manage network functions, meeting the growing demand for connectivity. Businesses in emerging markets are undergoing digital transformation to stay competitive in the global economy. NFV supports this transformation by providing flexible and scalable network solutions. Enterprises in sectors such as finance, healthcare, and retail can leverage NFV to enhance their network performance, improve security, and streamline operations. Governments in emerging markets are investing in digital infrastructure and smart city projects to drive economic development and improve the quality of life for their citizens. NFV plays a crucial role in these initiatives by enabling the deployment of advanced network services and supporting the integration of IoT and smart city applications.
NETWORK FUNCTION VIRTUALIZATION MARKET REPORT COVERAGE:
|
REPORT METRIC
|
DETAILS
|
|
Market Size Available
|
2023 - 2030
|
|
Base Year
|
2023
|
|
Forecast Period
|
2024 - 2030
|
|
CAGR
|
18.9% |
|
Segments Covered
|
By Type, Distribution Channel and Region
|
|
Various Analyses Covered
|
Global, Regional & Country Level Analysis, Segment-Level Analysis, DROC, PESTLE Analysis, Porter’s Five Forces Analysis, Competitive Landscape, Analyst Overview on Investment Opportunities
|
|
Regional Scope
|
North America, Europe, APAC, Latin America, Middle East & Africa
|
|
Key Companies Profiled
|
Cisco Systems, VMware, Nokia, Ericsson, Huawei, Hewlett Packard Enterprise (HPE), Dell EMC, Juniper Networks, Affirmed Networks, Mavenir, Radisys, NEC Corporation, ZTE Corporation
|
Network Function Virtualization Market Segmentation: By Types
-
Hardware
-
Software
-
Services
The services segment remains the most dominant sub-type in the NFV market. The complexity of NFV deployments and the need for specialized expertise drive the demand for professional and managed services. Organizations rely on these services to navigate the challenges of NFV implementation, integration, and management, ensuring successful deployments and optimal network performance.
The software segment is the fastest-growing sub-type in the NFV market. The increasing demand for VNFs and orchestration tools is driving this growth, as organizations seek to enhance their network capabilities and achieve greater flexibility. The adoption of cloud-native VNFs and advanced orchestration solutions is further accelerating the growth of the software segment.
Network Function Virtualization Market Segmentation: By Distribution Channel
Direct sales remain the most dominant distribution channel in the NFV market. This channel is preferred for large-scale projects and customized solutions, where personalized service and tailored offerings are essential. Telecommunications operators, enterprises, and cloud service providers rely on direct sales to access comprehensive NFV solutions and professional services.
Online platforms are the fastest-growing distribution channel in the NFV market. The convenience of online shopping, combined with the availability of a wide range of products and services, drives this growth. E-commerce websites and specialized NFV solution providers offer detailed product descriptions, customer reviews, and competitive pricing, making it easier for customers to make informed purchasing decisions.

Network Function Virtualization Market Segmentation: Regional Analysis
-
North America
-
Europe
-
Asia-Pacific
-
South America
-
The Middle East & Africa
North America, particularly the United States, boasts one of the most advanced telecommunications infrastructures in the world. Major telecom operators like AT&T, Verizon, and T-Mobile have been at the forefront of adopting NFV to modernize their networks, enhance service delivery, and reduce operational costs. These operators leverage NFV to support the deployment of 5G networks, which require flexible and scalable network architectures.
Asia-Pacific countries are undergoing rapid digital transformation, driven by increasing internet penetration, the proliferation of smartphones, and the expansion of e-commerce. Governments and enterprises in the region are investing heavily in digital infrastructure to support economic growth and enhance competitiveness. NFV plays a critical role in this transformation by providing scalable and flexible network solutions that can adapt to changing demands.
COVID-19 Impact Analysis on the Network Function Virtualization Market:
The immediate effect of the pandemic was a significant disruption to global supply chains. Lockdowns and travel restrictions hampered the production and movement of essential hardware components needed for NFV infrastructure. This resulted in shortages of servers, network equipment, and other critical elements, leading to delays in ongoing NFV deployments and impacting the market growth trajectory. However, the pandemic also presented unforeseen opportunities for the NFV market. The sudden shift to remote work and online learning caused a surge in internet traffic. Network operators scrambled to scale their infrastructure to accommodate the exponential rise in data consumption – a challenge traditionally addressed by adding more physical network function (NF) hardware. As economies began to recover, the NFV market witnessed a renewed interest. The success stories of rapid network scaling during the pandemic highlighted the benefits of NFV for improved agility and cost-efficiency. This spurred a focus on cloud-native VNFs – designed specifically to run on cloud platforms. These VNFs offer even greater ease of deployment, management, and scalability, further accelerating NFV adoption.
Latest Trends/ Developments:
One of the most significant trends is the emergence of Cloud-Native Network Functions (CNFs). These virtual network functions are specifically designed for cloud environments, leveraging containerization and microservices architecture. CNFs offer numerous advantages over traditional virtualized network functions (VNFS). The growing adoption of cloud-native applications and the rise of 5G networks are fueling the demand for CNFs. As service providers grapple with the complexities of managing a dynamic network landscape, CNFs offer a compelling solution for delivering cost-effective and scalable network services. The complexity of managing virtualized networks is increasing exponentially. To address this challenge, the industry is witnessing a surge in network automation and orchestration (A&O) solutions. These tools automate the deployment, configuration, and management of network functions, streamlining operations and reducing human error. A&O solutions leverage machine learning and artificial intelligence (AI) to gain real-time insights into network performance, enabling proactive problem identification and resolution.
Key Players:
-
Cisco Systems
-
VMware
-
Nokia
-
Ericsson
-
Huawei
-
Hewlett Packard Enterprise (HPE)
-
Dell EMC
-
Juniper Networks
-
Affirmed Networks
-
Mavenir
-
Radisys
-
NEC Corporation
-
ZTE Corporation


