Global Heatmap Software Tools Market Size (2023 – 2030)
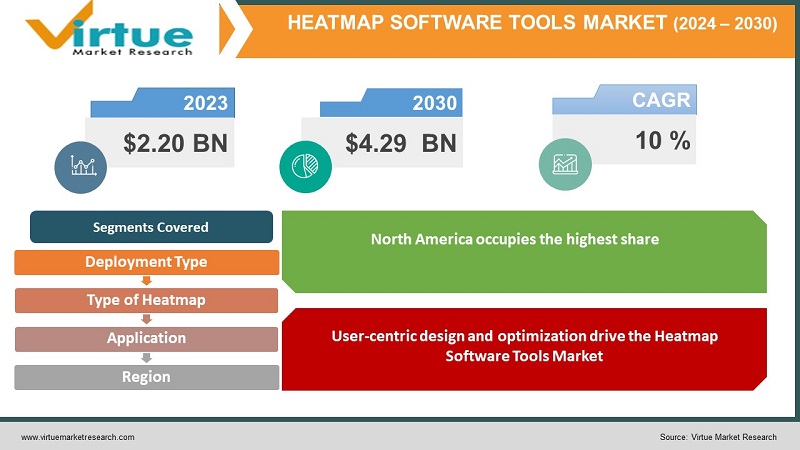
The Global Heatmap Software Tools Market was valued at USD 2.20 billion and is projected to reach a market size of USD 4.29 billion by the end of 2030. Over the forecast period of 2023-2030, the market is projected to grow at a CAGR of 10%.
Heatmap software tools give a visual representation of data and help businesses find user behavior on websites and applications. Heatmap software tools provide valuable insights for decision-making in businesses. The market has already seen dynamic growth due to increasing digitalization and online businesses. The importance of UX design and optimization of websites in business plays a major role in improving user satisfaction. This also creates demand for heatmap software tools. Artificial intelligence and machine learning in heatmap software tools enhance the analysis faster and help to increase business profit. User-centric design, website optimization, and Technological advancements with AI are the market drivers of the Global Heatmap Software Tools. In the future, with AI predictive analytics, it will be easier to predict trends and user behavior with greater accuracy. Key players in this market are Crazy Egg, Hotjar, and Mouseflow.
Key Market Insights:
According to a study, there is a 25% increase in website engagement with heatmap software tools. Heatmap software tools shape the future of web design and marketing. User-centric design and optimization drive the heatmap software tools market. In 2022, North America occupies the highest share of about 40% of the market and Asia-Pacific is the fastest-growing segment during the forecast period due to rapid digitalization and a surge in e-commerce.
Heatmap Software Tools Market Drivers:
User-centric design and optimization drive the Heatmap Software Tools Market
The UX design and optimization of websites in business plays a major role in improving user satisfaction. Heat map tools provide valuable insights into user behavior and how they interact with websites and applications. The business landscape is becoming more complex and competitive. With changing consumer behavior, market trends are also changing. There is greater competition in the market as more and more online businesses are emerging. This creates a demand for the Heatmap Software Tools. It helps businesses understand user interactions, patterns, and trends and helps them to make more profit-gaining decisions. In this way, they can stay ahead in this competitive environment.
Technological Advancements and the Integration of AI have boosted the Heatmap Software Tools Market
Recent technological innovations have transformed the heatmap software tools market. Heatmap software tools support various platforms, screen sizes, and devices due to advancements in devices and website technologies enabling them to analyze user data insights. Technological integration with AI led to advanced predictive analytics with greater accuracy. This helps the business to make more profit-gaining decisions with these valuable insights. Continuous development and research can lead to more advanced heatmap software tools. With the advent of technologies, the market is anticipated to witness significant growth in the coming years.

Heatmap Software Tools Market Restraints and Challenges
The major challenges faced by the heatmap software tools market is the data privacy and compliance concerns. Heatmap software tools involve gathering and analyzing data and should follow data regulation rules. Data protection regulations like GDPR, CCPA, and others can be complex and time-consuming for companies. For high-traffic websites, processing and analyzing data in real-time can be difficult. Another challenge is the high cost of heatmap software tools which affects small businesses.
Heatmap Software Tools Market Opportunities:
The heatmap software tools market has various opportunities in the market. With the advent of technologies and integration with AI, the market is anticipated to witness significant growth in the coming years. Advanced predictive analytics with greater accuracy helps the business to make more profit-gaining decisions with valuable insights. Also, data visualization is becoming popular with interactive dashboards. This provides clear, enhanced, and customized report analysis that helps the business make more profit-making decisions and further leads to the demand for heatmap software tools.
HEATMAP SOFTWARE TOOLS MARKET REPORT COVERAGE:
|
REPORT METRIC
|
DETAILS
|
|
Market Size Available
|
2022 - 2030
|
|
Base Year
|
2022
|
|
Forecast Period
|
2023 - 2030
|
|
CAGR
|
10%
|
|
Segments Covered
|
By Deployment Type, Type of Heatmap, Application, and Region
|
|
Various Analyses Covered
|
Global, Regional & Country Level Analysis, Segment-Level Analysis, DROC, PESTLE Analysis, Porter’s Five Forces Analysis, Competitive Landscape, Analyst Overview on Investment Opportunities
|
|
Regional Scope
|
North America, Europe, APAC, Latin America, Middle East & Africa
|
|
Key Companies Profiled
|
Crazy Egg, Hotjar, Mouseflow, Lucky Orange, FullStory, Clicktale (now part of Contentsquare), Zoho PageSense, Freshworks (formerly Freshmarketer), VWO (Visual Website Optimizer), Smartlook
|
Heatmap Software Tools Market Segmentation: By Deployment Type:
In 2022, based on market segmentation by deployment type, Cloud-based heatmap software tools occupy the highest share of 60% of the market. It is due to many factors. Cloud-based heatmap software tools offer easy scalability, accessibility, and flexibility and enable the business to adapt the changing user conditions. It is easier to use in work-from-home conditions. Many organizations are using cloud-based heatmap software tools because of their cost-effectiveness and efficiency in technology. On-premises heatmap software tools are the fastest-growing segment and are growing at a fast CAGR of 20% during the forecast period. Organizations that need strict data privacy and security requirements use On-premises heatmap software tools.
Heatmap Software Tools Market Segmentation: By Type of Heatmap:
In 2022, based on market segmentation by type of heatmap, Click heatmaps occupied the highest share of the market at around 40%. It gives insights into where users are clicking on the webpage. In this way, businesses can understand their interests and engagements. Many organizations require this kind of information so that they can make decisions that help them to get success. It helps in competitive strategy and is essential for businesses to make informed decisions regarding product development, marketing strategies, and overall market positioning.
User Interaction is the fastest-growing segment during the forecast period and is growing at a CAGR of more than 20%. They track various user interactions on the webpage like form submission and other engagement metrics.
Heatmap Software Tools Market Segmentation: By Application:
In 2022, the Website Optimization segment occupies the highest market share about 40% of the market. E-commerce is highly dynamic and competitive, with constant technological advancements and evolving market trends. Organizations depend on heatmap software tools to analyze user behavior and responses on their websites. This helps them to make data-driven decisions and improve overall user experience.
The fastest-growing segment is expected to be Mobile App Optimization. People are spending more time on mobile phones for various purposes. Thus understanding user interactions with mobile applications is important for businesses.
Heatmap Software Tools Market Segmentation: Regional Analysis:
-
North America
-
Asia-Pacific
-
Europe
-
South America
-
Middle East and Africa
In 2022, North America occupies the highest share of about 40% of the market. North America is a technologically advanced region with nations like the U.S. and Canada. The competition among businesses on online platforms is pretty high demanding more heatmap software tools. In this region, there are numerous ecommerce businesses in technology, healthcare, and finance. Also, the number of startups that rely on online platforms is increasing rapidly fueling the need for heatmap software tools.
Asia-Pacific is the fastest-growing segment during the forecast period due to rapid digitalization and surge in e-commerce. Growing digitalization and adoption of technology in developing countries like India and Southeast Asian nations drive the demand for heatmap software tools Businesses in countries like China strive for market leadership and global expansion creating a huge demand for heatmap software tools in coming years.

COVID-19 Impact Analysis on the Global Heatmap Software Tools Market:
The pandemic had a significant impact on the heatmap software tools market. Businesses had to deal with disruptions in supply chains, changes in customer behavior, and increased competition in the space. This led to a demand for heatmap software tools. Organizations wanted tools that could help them quickly adapt to changing market dynamics keep an eye on user behavior and spot opportunities. The pandemic accelerated the adoption of cloud-based solutions allowing for work and collaboration. The pandemic resulted in a surge in online businesses. The business landscape is becoming more complex and competitive. This demands more advanced heatmap software tools.
Latest Trends/ Developments:
One of the developments, in the Heatmap Software Tools Market is the rise in integration of artificial intelligence (AI) and machine learning (ML) capabilities. This advancement empowers businesses to automate and improve analytics. Obtain deeper insights from large amounts of user information. AI-powered Heatmap Software Tools enables organizations not to react to market changes but to proactively anticipate user actions providing a significant strategic advantage in today's fast-paced and highly competitive business environment. Furthermore, there is an increasing focus on real-time monitoring and alerts enabling companies to remain agile and responsive to shifts in their landscapes.
Key Players:
-
Crazy Egg
-
Hotjar
-
Mouseflow
-
Lucky Orange
-
FullStory
-
Clicktale (now part of Contentsquare)
-
Zoho PageSense
-
Freshworks (formerly Freshmarketer)
-
VWO (Visual Website Optimizer)
-
Smartlook


