
Global Data Center Visualization Market Research Report – Segmented By Type (Server, Storage, Network, Desktop, Application, and others); By Component (Software and Service); By Service (Advisory & Implementation Services, Optimization Services, Managed Services, and Technical Support Services); By Size (Small and Medium-Sized Enterprise and Large Enterprise); and Region - Size, Share, Growth Analysis | Forecast (2025 – 2030)
Data Center Visualization Market Size (2025 – 2030)
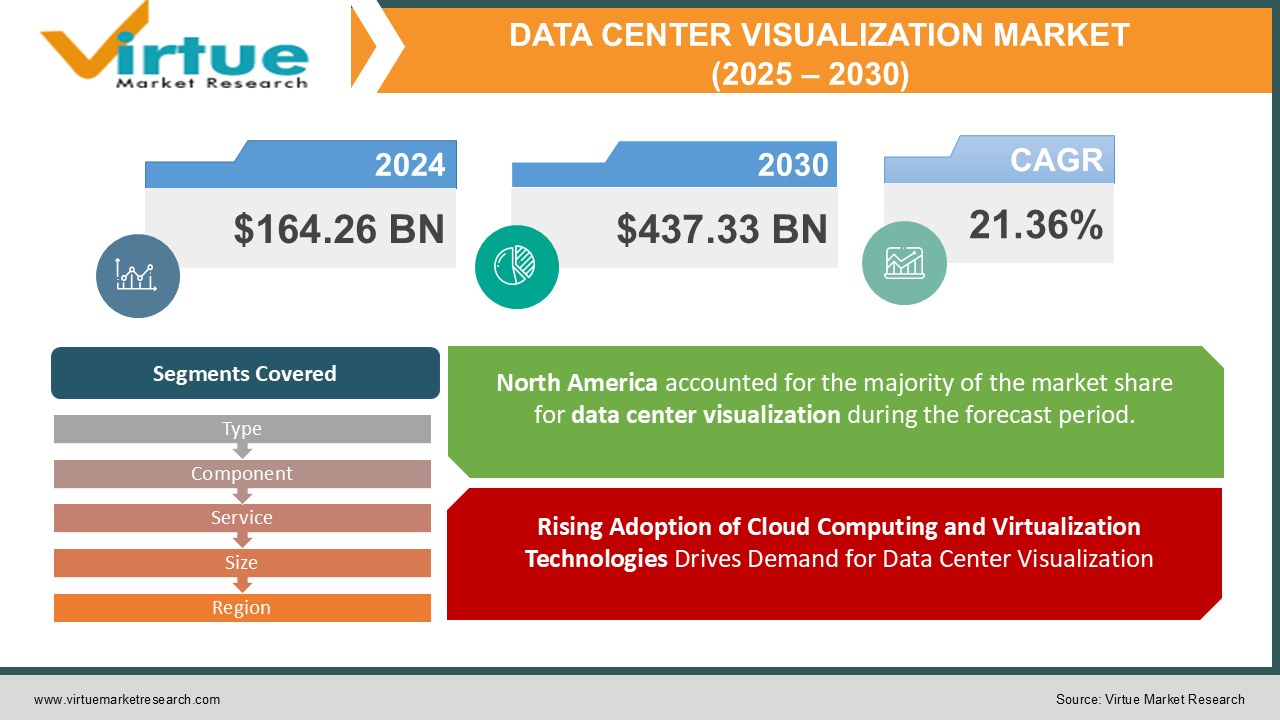
The Global Data Center Visualization Market was valued at USD 164.26 billion in 2024 and is projected to reach a market size of USD 437.33 billion by the end of 2030. Over the forecast period of 2025-2030, the market is projected to grow at a CAGR of 21.36%.
The Data Center Visualization Market is progressing rapidly as businesses increasingly adopt virtualization, cloud computing, and AI-driven infrastructure management to improve operational efficiency. With the intricacy of modern data centers, organizations are leveraging visualization tools to optimize resource allocation, track real-time performance, and improve security. These solutions provide a comprehensive view of network components, storage, and computing power, allowing businesses to enhance scalability, reduce downtime, and streamline IT operations. As enterprises decline toward software-defined data centers (SDDCs) and hybrid cloud environments, the demand for advanced visualization solutions continues to rise, driving significant market growth.
Key Market Insights:
-
The wider implementation of cloud computing and virtualization is a major key for the Data Center Visualization market. Studies indicate that over 90% of enterprises have already adopted some form of cloud infrastructure, with numerous people transitioning to hybrid and multi-cloud strategies. Additionally, around 80% of businesses are investing in data center visualization tools to enhance operational efficiency and reduce IT infrastructure complexity. These tools help organizations manage real-time data traffic, resource allocation, and system performance, ensuring seamless operations and cost savings.
-
The rising adoption of AI-powered and software-defined data centers (SDDCs) is also leading the market. Research shows that more than 60% of global data centers are integrating AI-driven visualization solutions to enhance predictive maintenance, automate workflows, and improve security monitoring. With the surge in big data analytics, companies require real-time visualization capabilities to manage the massive influx of data and optimize workloads across different environments.
-
Furthermore, the increasing risks of cyber threats and data breaches have caused an increased need for advanced security visualization tools. Studies suggest that nearly 65% of enterprises are investing in real-time security visualization solutions to detect anomalies, monitor suspicious activity, and prevent cyberattacks. As regulatory compliance requirements become stricter, businesses are leveraging data center visualization technologies to ensure transparency and adherence to industry standards.
Data Center Visualization Market Drivers:
Rising Adoption of Cloud Computing and Virtualization Technologies Drives Demand for Data Center Visualization
The rapid shift toward cloud computing and virtualization has major increased in the intricacy of managing data centers, driving the need for advanced visualization solutions. Businesses are increasingly adopting hybrid and multi-cloud strategies, requiring real-time monitoring and management of distributed infrastructures. Data center visualization tools help IT teams gain deeper insights into performance metrics, network traffic, and resource utilization, improving efficiency and reducing downtime. As organizations continue proceeding workloads to the cloud, the demand for robust visualization solutions is expected to rise. Additionally, the growing emphasis on software-defined data centers (SDDCs) is further accelerating the need for sophisticated visualization tools.
Growing Concerns Over Energy Efficiency and Sustainability Propel Market Growth
Energy consumption in data centers has become a major concern due to rising operational costs and environmental impact. With severe government regulations and corporate sustainability goals, businesses are milking data center visualization tools to optimize energy usage. These solutions furnish real-time insights into power consumption, cooling efficiency, and equipment performance, enabling data centers to reduce their carbon footprint. AI-driven visualization platforms can identify inefficiencies and recommend optimization strategies, leading to cost savings and improved environmental compliance. As companies aim to build greener and more sustainable data centers, the adoption of visualization technologies will continue to rise.
Increasing Need for Enhanced Security and Risk Management Drives Need for Visualization Solutions
Cybersecurity threats and data breaches have grown, making it imperative for organizations to monitor and secure their data center environments. Advanced visualization solutions provides a comprehensive view of network activity, anomaly detection, and potential vulnerabilities, helping IT teams proactively respond to threats. With cyberattacks becoming more sophisticated, companies are integrating AI and machine learning with visualization tools to strengthen security measures. Additionally, compliance with stringent data protection regulations such as GDPR and CCPA is compelling businesses to invest in real-time security monitoring solutions. The growing focus on data security will further accelerate the demand for data center visualization tools.

Data Center Visualization Market Restraints and Challenges:
Increasing Implementation Costs and Complex Integration Pose Significant Challenges to Market Growth
The fostering of data center visualization solutions is often hindered by the steep upfront costs associated with software, hardware, and infrastructure upgrades. Many organizations, particularly small and medium-sized enterprises (SMEs), struggle to allocate budgets for advanced visualization tools due to financial constraints. Additionally, consolidating these solutions with existing IT infrastructure can be complex, requiring significant customization and expertise. Compatibility issues with legacy systems further add to implementation difficulties, increasing the time and cost of deployment.
Data Center Visualization Market Opportunities:
The rising adoption of cloud-based data center visualization solutions offers a major opportunity for market growth. As enterprises are adopting cloud infrastructures, there is a growing need for real-time monitoring, enhanced security, and predictive analytics, all of which can be efficiently managed through visualization tools. Cloud-based solutions provide scalability, cost-effectiveness, and accessibility, making them an attractive option for businesses of all sizes.
Additionally, the integration of artificial intelligence (AI) and machine learning (ML) in data center visualization is transforming operational efficiency by enabling proactive decision-making, anomaly detection, and automated workflows. AI-powered visualization tools help optimize power usage, network performance, and workload distribution, overall improving overall data center efficiency. As more organizations embrace AI-driven technologies, the demand for advanced visualization solutions is expected to surge, opening new revenue streams for market players.
DATA CENTER VISUALIZATION MARKET REPORT COVERAGE:
|
REPORT METRIC |
DETAILS |
|
Market Size Available |
2024 - 2030 |
|
Base Year |
2024 |
|
Forecast Period |
2025 - 2030 |
|
CAGR |
21.36% |
|
Segments Covered |
By Type, Component, Service, Size, and Region |
|
Various Analyses Covered |
Global, Regional & Country Level Analysis, Segment-Level Analysis, DROC, PESTLE Analysis, Porter’s Five Forces Analysis, Competitive Landscape, Analyst Overview on Investment Opportunities |
|
Regional Scope |
North America, Europe, APAC, Latin America, Middle East & Africa |
|
Key Companies Profiled |
Cisco Systems, Inc., VMware, Inc., Huawei Technologies Co., Ltd., Microsoft Corporation, IBM Corporation, Dell Technologies Inc., Hewlett Packard Enterprise (HPE), Citrix Systems, Inc., Fujitsu Limited, NVIDIA Corporation, Red Hat, Inc., NetApp, Inc., Schneider Electric SE |
Data Center Visualization Market Segmentation: By Type
-
Server
-
Storage
-
Network
-
Desktop
-
Application
-
Others
The server segment has supremacy in the data center visualization market, as servers form the backbone of data center operations, handling computing power, storage, and workload distribution. Organizations heavily invest in server visualization to upgrade resource allocation, enhance security, and improve operational efficiency.
On the other hand, network visualization is the growing rapidly due to the rising complexity of network infrastructures and high demand for real-time traffic monitoring, security analytics, and automated network management. With the expansion of cloud computing, IoT, and 5G technologies, enterprises are prioritizing network visualization to enhance performance, reduce downtime, and prevent cyber threats.
Data Center Visualization Market Segmentation: By Component
-
Software
-
Service
The software segment authoritative the data center visualization market, as advanced visualization tools are necessary for optimizing data center operations, enhancing security, and enabling real-time monitoring. Businesses rely on software solutions for efficient resource management, workload automation, and predictive analytics, making them a critical investment for modern data centers.
Meanwhile, the services segment is experiencing the fastest growth due to the increasing need for expert consultation, integration, and maintenance services. As enterprises embrace complex visualization solutions, they need specialized support for seamless deployment, customization, and ongoing optimization. Managed services, training, and technical support are in high demand, driving rapid expansion in this segment.
Data Center Visualization Market Segmentation: By Service
-
Advisory & Implementation Services
-
Optimization Services
-
Managed Services
-
Technical Support Services
The managed services segment acquires the dominant position in the data center visualization market, as businesses majorly rely on third-party providers to handle IT infrastructure, security, and performance monitoring. With the rise of cloud computing and virtualization, organizations prefer managed services to reduce operational costs, ensure real-time monitoring, and improve overall efficiency.
On the other hand, optimization services are the rapidly growing segment, driven by the need to improve data center performance, reduce downtime, and improve energy efficiency. As enterprises continue to scale their IT infrastructure, they seek advanced optimization solutions to fine-tune resource allocation, automate workflows, and minimize latency, fueling rapid growth in this segment.
Data Center Visualization Market Segmentation: By Size
-
Small and Medium-Sized Enterprise (SMEs)
-
Large Enterprise
The large enterprise segment dominates the data center visualization market, as these organizations operate vast IT foundation requiring advanced visualization tools for monitoring, security, and resource management. Large enterprises prioritize scalability, automation, and high-performance computing, making them the primary adopters of sophisticated data center visualization solutions.
Meanwhile, small and medium-sized enterprises (SMEs) are feeling the fastest growth in adoption. With enhancing digital transformation, cloud adoption, and virtualization, SMEs are investing in cost-effective visualization tools to optimize their IT operations. The growing availability of scalable and cloud-based solutions makes it easier for SMEs to implement advanced visualization technologies, driving significant market expansion.

Data Center Visualization Market Segmentation: Regional Analysis
-
North America
-
Asia-Pacific
-
Europe
-
South America
-
Middle East and Africa
North America contributes the largest share in the data center visualization market, contributing around 35% of the global market. This dominance is convinced by the region’s advanced IT infrastructure, high adoption of cloud computing, and enhanced investments by major technology firms. The presence of key players and a strong emphasis on cybersecurity and virtualization technologies further strengthen North America's leadership in this sector.
Asia-Pacific is the fastest-growing region, with an increasing adoption rate of data center visualization solutions. Contributing approximately 30%, the region's rapid growth is compelled by the expansion of cloud services, rising digital transformation initiatives, and the growing number of hyperscale data centers. Countries like China, India, and Japan are leading this growth, supported by government initiatives, increasing enterprise demand, and investments in data infrastructure.
COVID-19 Impact Analysis on the Global Data Center Visualization Market:
The COVID-19 pandemic significantly rosed the need for data center visualization solutions as organizations influenced to remote work and cloud-based operations. With businesses depending majorly on digital infrastructure, the need for efficient data center management and real-time monitoring surged. The pandemic also highlighted vulnerabilities in traditional data centers, leading to increased investments in virtualization technologies to enhance flexibility, scalability, and remote accessibility. Additionally, the global supply chain disturbance caused declarations in hardware procurement and deployment. However, the crisis ultimately acted as a catalyst for digital transformation, pushing enterprises and service providers to adopt more advanced visualization tools to ensure operational continuity, disaster recovery, and optimized resource utilization. As a result, the data center visualization market experienced rapid growth, with long-term trends favoring continued investment in virtualized and automated data center solutions.
Latest Trends/ Developments:
The data center visualization market is experiencing rapid advancements influenced by AI-powered automation, real-time analytics, and digital twin technology. AI-driven visualization tools are enabling predictive maintenance, automated resource allocation, and enhanced security monitoring, reducing downtime and optimizing efficiency. Digital twin technology is acquiring traction, allowing operators to create virtual replicas of data centers for real-time monitoring, testing, and performance optimization. Additionally, the integration of augmented reality (AR) and virtual reality (VR) is revolutionizing data center management by providing immersive visualization and remote troubleshooting capabilities.
Another key trend is the rising consideration of cloud-based data center visualization solutions, driven by the increasing reliance on hybrid and multi-cloud environments. Enterprises are leveraging cloud-based platforms to achieve scalability, cost-efficiency, and seamless integration with existing IT infrastructure. The focus on sustainability is also shaping the market, with companies enabling energy-efficient visualization solutions to optimize power consumption, reduce carbon footprints, and comply with green data center initiatives. These trends indicate a strong push toward smarter, more sustainable, and highly automated data center ecosystems.
Key Players:
-
Cisco Systems, Inc.
-
VMware, Inc.
-
Huawei Technologies Co., Ltd.
-
Microsoft Corporation
-
IBM Corporation
-
Dell Technologies Inc.
-
Hewlett Packard Enterprise (HPE)
-
Citrix Systems, Inc.
-
Fujitsu Limited
-
NVIDIA Corporation
-
Red Hat, Inc.
-
NetApp, Inc.
-
Schneider Electric SE
Chapter 1. Data Center Visualization Market – Scope & Methodology
1.1 Market Segmentation
1.2 Scope, Assumptions & Limitations
1.3 Research Methodology
1.4 Primary Sources
1.5 Secondary Sources
Chapter 2. Data Center Visualization Market – Executive Summary
2.1 Market Size & Forecast – (2025 – 2030) ($M/$Bn)
2.2 Key Trends & Insights
2.2.1 Demand Side
2.2.2 Supply Side
2.3 Attractive Investment Propositions
2.4 COVID-19 Impact Analysis
Chapter 3. Data Center Visualization Market – Competition Scenario
3.1 Market Share Analysis & Company Benchmarking
3.2 Competitive Strategy & Development Scenario
3.3 Competitive Pricing Analysis
3.4 Supplier-Distributor Analysis
Chapter 4. Data Center Visualization Market Entry Scenario
4.1 Regulatory Scenario
4.2 Case Studies – Key Start-ups
4.3 Customer Analysis
4.4 PESTLE Analysis
4.5 Porters Five Force Model
4.5.1 Bargaining Power of Suppliers
4.5.2 Bargaining Powers of Customers
4.5.3 Threat of New Entrants
4.5.4 Rivalry among Existing Players
4.5.5 Threat of Substitutes
Chapter 5. Data Center Visualization Market – Landscape
5.1 Value Chain Analysis – Key Stakeholders Impact Analysis
5.2 Market Drivers
5.3 Market Restraints/Challenges
5.4 Market Opportunities
Chapter 6. Data Center Visualization Market – By Type
6.1 Introduction/Key Findings
6.2 Server
6.3 Storage
6.4 Network
6.5 Desktop
6.6 Application
6.7 Others
6.8 Y-O-Y Growth trend Analysis By Type
6.9 Absolute $ Opportunity Analysis By Type, 2025-2030
Chapter 7. Data Center Visualization Market – By Component
7.1 Introduction/Key Findings
7.2 Software
7.3 Service
7.4 Y-O-Y Growth trend Analysis By Component
7.5 Absolute $ Opportunity Analysis By Component, 2025-2030
Chapter 8. Data Center Visualization Market – By Service
8.1 Introduction/Key Findings
8.2 Advisory & Implementation Services
8.3 Optimization Services
8.4 Managed Services
8.5 Technical Support Services
8.6 Y-O-Y Growth trend Analysis By Service
8.7 Absolute $ Opportunity Analysis By Service, 2025-2030
Chapter 9. Data Center Visualization Market – By Size
9.1 Introduction/Key Findings
9.2 Small and Medium-Sized Enterprise (SMEs)
9.3 Large Enterprise
9.4 Y-O-Y Growth trend Analysis By Size
9.5 Absolute $ Opportunity Analysis By Size, 2025-2030
Chapter 10. Data Center Visualization Market, By Geography – Market Size, Forecast, Trends & Insights
10.1 North America
10.1.1 By Country
10.1.1.1 U.S.A.
10.1.1.2 Canada
10.1.1.3 Mexico
10.1.2 By Type
10.1.2.1 By Component
10.1.3 By Service
10.1.4 Countries & Segments - Market Attractiveness Analysis
10.2 Europe
10.2.1 By Country
10.2.1.1 U.K
10.2.1.2 Germany
10.2.1.3 France
10.2.1.4 Italy
10.2.1.5 Spain
10.2.1.6 Rest of Europe
10.2.2 By Type
10.2.3 By Component
10.2.4 By Service
10.2.5 By Size
10.2.6 Countries & Segments - Market Attractiveness Analysis
10.3 Asia Pacific
10.3.1 By Country
10.3.1.1 China
10.3.1.2 Japan
10.3.1.3 South Korea
10.3.1.4 India
10.3.1.5 Australia & New Zealand
10.3.1.6 Rest of Asia-Pacific
10.3.2 By Type
10.3.3 By Component
10.3.4 By Service
10.3.5 By Size
10.3.6 Countries & Segments - Market Attractiveness Analysis
10.4 South America
10.4.1 By Country
10.4.1.1 Brazil
10.4.1.2 Argentina
10.4.1.3 Colombia
10.4.1.4 Chile
10.4.1.5 Rest of South America
10.4.2 By Type
10.4.3 By Component
10.4.4 By Service
10.4.5 By Size
10.4.6 Countries & Segments - Market Attractiveness Analysis
10.5 Middle East & Africa
10.5.1 By Country
10.5.1.1 United Arab Emirates (UAE)
10.5.1.2 Saudi Arabia
10.5.1.3 Qatar
10.5.1.4 Israel
10.5.1.5 South Africa
10.5.1.6 Nigeria
10.5.1.7 Kenya
10.5.1.8 Egypt
10.5.1.9 Rest of MEA
10.5.2 By Type
10.5.3 By Component
10.5.4 By Service
10.5.5 By Size
10.5.6 Countries & Segments - Market Attractiveness Analysis
Chapter 11. Data Center Visualization Market – Company Profiles – (Overview, Product Portfolio, Financials, Strategies & Developments)
11.1 Cisco Systems, Inc.
11.2 VMware, Inc.
11.3 Huawei Technologies Co., Ltd.
11.4 Microsoft Corporation
11.5 IBM Corporation
11.6 Dell Technologies Inc.
11.7 Hewlett Packard Enterprise (HPE)
11.8 Citrix Systems, Inc.
11.9 Fujitsu Limited
11.10 NVIDIA Corporation
11.11 Red Hat, Inc.
11.12 NetApp, Inc.
11.13 Schneider Electric SE
Download Sample
Choose License Type
2500
4250
5250
6900
Frequently Asked Questions
The Global Data Center Visualization Market was valued at USD 164.26 billion in 2024 and is projected to reach a market size of USD 437.33 billion by the end of 2030. Over the forecast period of 2023-2030, the market is projected to grow at a CAGR of 21.36%.
Increasing demand for efficient data management, scalability, and real-time analytics is driving the market.
Based on component, the Global Medical Tourism Market is segmented into software and service.
North America is the most dominant region for the Global Data Center Visualization Market.
Cisco Systems, Inc., VMware, Inc., Huawei Technologies Co., Ltd., Microsoft Corporation are the leading players in the Global Data Center Visualization Market.