AR and VR Visualization Market Size (2023-2030)
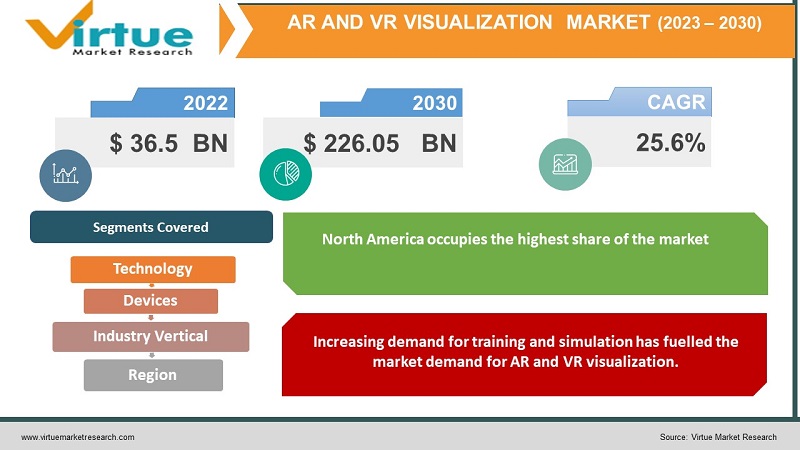
The Global AR and VR Visualization Market was estimated to be worth USD 36.5 billion in 2022 and is anticipated to reach a value of USD 226.05 Billion by 2030, growing at a fast CAGR of 25.6% during the forecast period 2023-2030.
AR and VR are immersive visualization technologies that enhance real-world environments by showcasing them virtually. AR (Augmented Reality) can be experienced via various devices such as smartphones, tablets, smart glasses, and headsets. It allows users to interact with the virtual object while being aware of the real-time surroundings around them. AR technology is widely used in gaming, education, healthcare, and industrial training. For example, AR is used in gaming for placing virtual characters or objects in the real world, creating an exciting gaming experience. Moreover, AR is widely used in education to display 3D models that make learning more interactive and engaging for the students. Furthermore, VR or Virtual Reality provides a virtual environment to the users that enables them to interact with the object using a headset or VR goggles. It replaces the real world with a simulated one that allows users to interact in a 360-degree view. Further, VR has wide applications in gaming, training, and education. For instance, it is widely used in medical surgery training. Furthermore, the growing gaming industry has increased the demand for AR and VR visualization in the market.
Global AR and VR Visualization Market Drivers:
Increasing demand for training and simulation has fuelled the market demand for AR and VR visualization.
AR and VR are increasingly demanded in training and simulation as it provides practical training and replicates real-world scenarios to the users that help them to learn and experience different situations. Moreover, these technologies provide trainees to practice skills, procedures, operations, and tasks without getting physically damaged. For instance, AR and VR are used in healthcare to train surgeons by providing them with a virtual environment to treat patients. In addition, VR technology is widely used in aviation training by proving real-world challenges to aviation professionals and increasing their efficiency. Moreover, with the help of AR and VR, people can repeatedly practice tasks in a virtual environment such as sports trainees or athletes can practice their movements, improve techniques, and improve their performance. Additionally, these technologies track the performance of the user and provide meaningful feedback that can enhance the overall efficiency of an individual.
The rising use of AR and VR in entertainment is fuelling the market demand for AR and VR visualization market.
AR and VR are increasingly used in gaming and media as it offers an interactive and immersive experience, making game players feel like they are physically present in the virtual world. VR or virtual reality offers users to interact with the virtual environment, and virtual objects, and engage in a realistic gameplay setting. This has further raised the demand for VR headsets and VR goggles in the market. Moreover, the increase in the use of mobile phones has contributed to the mobile gaming industry and gradually to the AR and VR visualization market. Due to this, mobile AR games have gained immense popularity due to their accessibility and flexibility. Further, the demand for realistic cinematic experiences has increased the usage of VR devices and 360-degree videos in the media industry. Further, post-pandemic, there was a rise in virtual concerts and shows, which bolstered the usage of VR technologies for attending live performances and engaging with others in the virtual environment.

Global AR and VR Visualization Market Challenges:
Hardware compatibility issues can reduce the demand for AR and VR visualization in the market. These technologies rely mostly on hardware devices such as headsets, glasses, and smartphones, which can sometimes not be compatible with some devices and software versions and can result in reduced functioning.
Further, technical limitations such as resolution issues, latency issues, system lagging, and other constraints can decline the market demand for AR and VR visualization in the market.
Apart from this, the expensive cost of advanced AR and VR software and hardware solutions can decline its demand in the market.
Global AR and VR Visualization Market Opportunities:
The Global AR and VR Visualization Market is anticipated to deliver lucrative opportunities for businesses, which include acquisitions, partnerships, collaborations, product launches, and agreements during the forecasted period. Furthermore, the growing demand for interactive gaming experiences and increased demand by schools for practical and immersive learning is predicted to develop the market for AR and VR Visualization and enhance its future growth opportunities.
COVID-19 Impact on the Global AR and VR Visualization Market:
The pandemic had a positive impact on the AR and VR visualization market. Due to the lockdown, offices, educational institutions, and major industries were closed down, which emphasized remote working and learning and raised the demand for AR and VR visualization in the market. Further, there was an increase in virtual events and training, which increased the usage of virtual reality tools. Moreover, due to the closure of physical stores, there was an increased presence of brands on e-commerce platforms, which enriched customer shopping experience through virtual showrooms, where they could try the product and make better purchasing decisions.
Global AR and VR Visualization Market Recent Developments:
- In June 2023, Amrita Hospital in Kochi, India, launched an extended reality ecosystem in healthcare, which leverages AR and VR technologies. It aims to enhance capabilities in patent care, medical training, and research.
- In June 2023, MediSim VR launched Innovate 360, a pre-medical three-day program for high-school students to provide them with a hands-on practical, and experiential learning ecosystem.
- In December 2022, TC Columbia University in collaboration with Digital Futures Institute launched an immersive VR learning experience for public schools in New York. It aimed to provide an immersive learning experience in STEAM (Science, Technology, Engineering, Arts, and Mathematics) subjects.
AR AND VR VISUALIZATION MARKET REPORT COVERAGE:
|
REPORT METRIC
|
DETAILS
|
|
Market Size Available
|
2022 - 2030
|
|
Base Year
|
2022
|
|
Forecast Period
|
2023 - 2030
|
|
CAGR
|
25.6%
|
|
Segments Covered
|
By Technology, Devices, Industry vertical, and Region
|
|
Various Analyses Covered
|
Global, Regional & Country Level Analysis, Segment-Level Analysis, DROC, PESTLE Analysis, Porter’s Five Forces Analysis, Competitive Landscape, Analyst Overview on Investment Opportunities
|
|
Regional Scope
|
North America, Europe, APAC, Latin America, Middle East & Africa
|
|
Key Companies Profiled
|
Microsoft, Google, Facebook, Novatech, Zumoko, Datamatics Global Services Limited, Neilsoft, 9dxr, Surgical Science , DevDen Solutions
|
Global AR and VR Visualization Market Segmentation:
Global AR and VR Visualization Market Segmentation: By Technology
- AR
- Markerless AR
- Marker-Based AR
- Projection-Based AR
- VR
- Motion Controllers
- Room-Scale VR
- Position Tracking
- Head-Mounted Displays
Based on market segmentation by technology, the markerless AR segment in AR occupies the highest share of the market. Markerless AR of simultaneous localization and mapping, does not require any markers to indicate the object. Rather, it uses the device’s sensors to analyze and map the environment by using the camera, GPS, accelerometer, gyroscope, and other sensors. Further, these sensors help the user to understand surrounding environments and track the position and orientation of the object in motion. Moreover, these systems use computer-vision algorithms to detect and track objects, the surrounding environment, surfaces, and other objects that allow users to interact effectively with the virtual environment.
The projection-based AR is the fastest-growing segment in the AR segment. Projection-based software that projects objects onto surfaces. It uses projectors to display augmented content on real-world objects and is widely used in interactive displays, museums, buildings, artistic installations, and others for creating a seamless integration between the virtual and real or physical worlds.
Head-mounted displays in the VR segment occupy the highest share of the market. These are VR headsets worn on the user’s head, allowing them to completely immerse into the virtual environment. These devices consist of high-definition displays for each eye, advanced lenses to focus on images, and built-in sensors for head tracking. Moreover, the displays offer a 3D experience to the user, making them popular in the gaming industry.
Motion controllers are the fastest-growing segment in the VR segment. These are handheld devices that allow users to interact and manipulate virtual objects that are widely used in gaming. Further, these controllers are equipped with tracking sensors, buttons, triggers, and other mechanisms that allow virtual avatars to interact with the objects easily, providing an immersive experience to the users.
Global AR and VR Visualization Market Segmentation: By Devices
- Smartphones and Tablets
- Mixed Reality Devices
- Head-Mounted Devices
- Others
Based on market segmentation by devices, smartphones, and tablets occupies the highest share of the market. Smartphones and tablets are widely used for AR and VR visualization due to their accessibility and flexibility. Moreover, they have in-built cameras, sensors, and high-processing power that leverage the use of AR and VR technology. Additionally, mobile AR and VR applications can be downloaded on the smartphone or tablets and can be accessed easily by connecting to VR goggles or glasses.
The mixed-reality devices are the fastest-growing segment during the forecast period. These are hybrid devices that merge elements of both AR and VR and allow users to interact with both virtual and real-world objects at the same time. Moreover, these devices offer the ability to place the object in real time and enable users to interact with them. Microsoft Hololens is one such example of a mixed-reality device.
Global AR and VR Visualization Market Segmentation: By Industry Vertical
- Entertainment & Gaming
- Education
- Healthcare
- Automotive
- Others
Based on market segmentation by industry vertical, the entertainment & gaming segment occupies the highest share of the market. AR and VR are increasingly used in the entertainment industry for enhanced gaming experience. Virtual reality gaming offers an immersive and interactive gaming experience to gamers by depicting a 3D game setting with interactive features. For instance, Star Wars: Squadrons VR game. Further, AR gaming has also gained popularity due to easy accessibility and compatibility with mobile devices. For instance, Pokemon Go gained immense popularity among players due to its exciting graphics and realistic gaming experience. Furthermore, AR and VR are widely used for cinematic experiences, experiencing virtual theme parks, and virtual music concerts.
The education segment is the fastest-growing segment during the forecast period. AR and VR visualization is increasingly used in the education sector to provide practical and skillful training to students. Further, VR allowed students to gain an enhanced learning experience such as exploring historical monuments, and geographical sites, and practicing experiments in virtual labs. Furthermore, AR provided interactive learning experiences to students by creating attractive digital content that offered experiential learning and remote education options to students.
Global AR and VR Visualization Market Segmentation: By Region
- North America
- Europe
- Asia Pacific
- Middle East and Africa
- South America
Based on market segmentation by region, North America occupies the highest share of the market. The prevalence of established tech companies and innovations in AR & VR technology has contributed to the demand for AR and VR visualization in the region. Major tech players such as Microsoft, Google, and Oculus have contributed to the growth of AR and VR technology by constantly introducing innovations in the market. These innovations include mixed-reality headsets, mobile-compatible AR applications, mobile-compatible VR gaming, cloud-based AR and VR services, and others.
Asia-Pacific is the fastest-growing region during the forecast period. The increasing demand for practical and skillful training in the education sector has contributed to the growth of AR and VR visualization in the region. For instance, in July 2022, in India, Chennai-based tech startup – Meynikara Solutions Pvt Ltd launched virtual labs in three government schools and two corporation schools. The virtual lab is named Meta Kalvi and is designed for teaching Maths and Science from 6-9th grade classes in both Tamil and English language.
Global AR and VR Visualization Market Key Players:
- Microsoft
- Google
- Facebook
- Novatech
- Zumoko
- Datamatics Global Services Limited
- Neilsoft
- 9dxr
- Surgical Science
- DevDen Solutions


