Advanced Visualization Market Size (2025 – 2030)
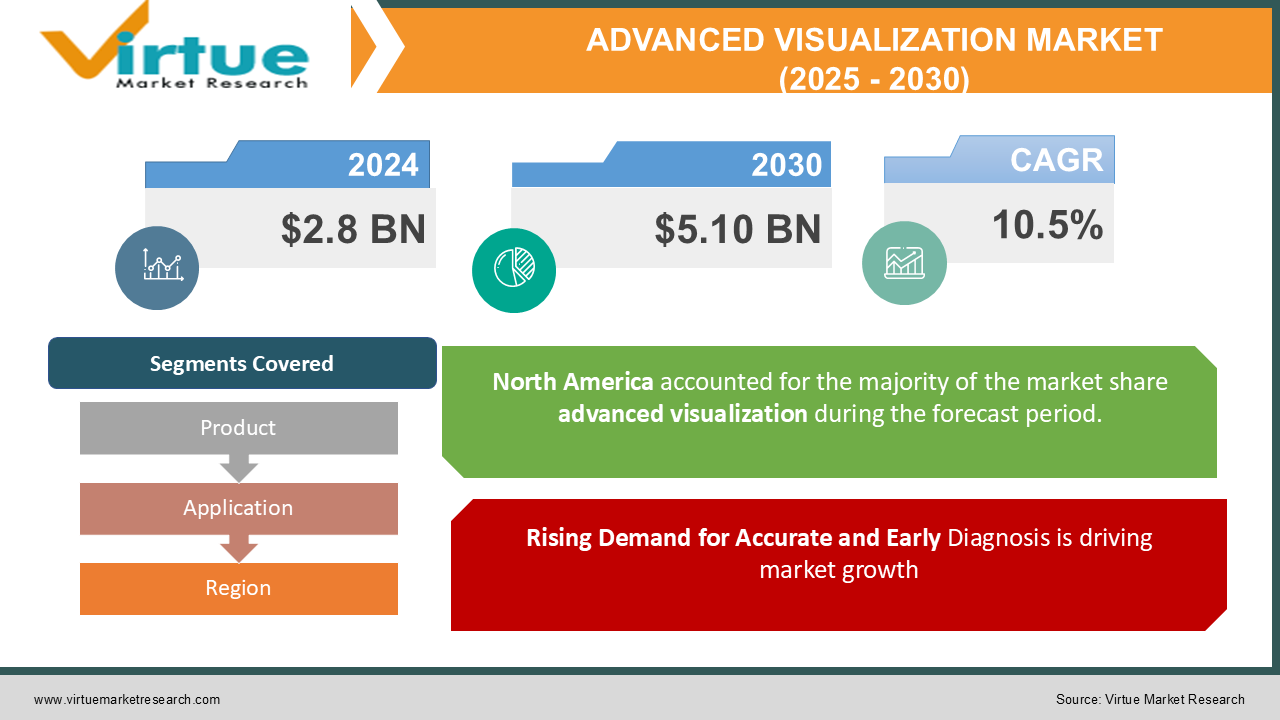
The Global Advanced Visualization Market was valued at USD 2.8 billion in 2024 and is projected to grow at a CAGR of 10.5% from 2025 to 2030. The market is expected to reach USD 5.10 billion by 2030.
The Advanced Visualization Market focuses on cutting-edge imaging solutions used to enhance diagnostic accuracy and treatment planning in healthcare. These solutions integrate sophisticated software and imaging modalities to generate 2D, 3D, and 4D visualizations, improving decision-making in medical specialties such as radiology, cardiology, and oncology. The market is driven by increasing healthcare demands, technological innovations, and the growing need for personalized medicine.
Key Market Insights
-
The integration of AI and machine learning in advanced visualization tools is accelerating the accuracy of diagnoses, improving detection rates by over 25%.
-
Cloud-based advanced visualization platforms are gaining traction, growing at a CAGR of 12% due to their cost-effectiveness and scalability.
-
The Asia-Pacific region is the fastest-growing market, with a CAGR of 13%, driven by increasing healthcare expenditure and digital transformation in emerging economies.
Global Advanced Visualization Market Drivers
Rising Demand for Accurate and Early Diagnosis is driving market growth:
The increasing prevalence of chronic diseases such as cancer, cardiovascular disorders, and neurological conditions is a major driver of the advanced visualization market. Accurate and early diagnosis is critical in improving patient outcomes, and advanced visualization tools enable detailed imaging that supports precise detection. With the World Health Organization estimating over 19 million new cancer cases annually, healthcare providers are prioritizing technologies that offer superior diagnostic capabilities. The ability of these solutions to integrate data from multiple imaging modalities enhances their utility in complex clinical scenarios, boosting their adoption across the globe.
Technological Advancements in Imaging Modalities is driving market growth:
Technological innovations, such as AI-driven imaging, hybrid imaging systems, and 4D visualization, are propelling the market forward. AI integration enhances image analysis, reducing interpretation time and increasing diagnostic accuracy. Hybrid imaging technologies, such as PET-MRI and PET-CT, provide comprehensive insights by combining functional and anatomical data in a single scan. Additionally, the development of advanced rendering software for 4D visualization enables dynamic imaging, capturing movement in real-time. These advancements are driving healthcare providers to adopt advanced visualization systems as standard tools in clinical workflows.
Growing Adoption of Cloud-Based Solutions is driving market growth: The shift toward cloud-based advanced visualization platforms is transforming the market landscape. These solutions offer several advantages, including remote accessibility, cost-effectiveness, and seamless integration with hospital information systems. Cloud technology also facilitates real-time collaboration among healthcare professionals, improving decision-making in critical cases. As healthcare organizations focus on operational efficiency and scalability, cloud-based systems are becoming increasingly popular, especially in multi-site hospital networks and telemedicine applications. This trend is expected to accelerate market growth over the forecast period.

Global Advanced Visualization Market Challenges and Restraints
High Initial Investment and Operational Costs is restricting market growth:
The implementation of advanced visualization systems requires significant financial investment, including the cost of software, hardware, and infrastructure upgrades. Smaller healthcare providers and clinics often find it challenging to adopt these technologies due to budget constraints. Additionally, ongoing operational costs, such as software licensing, maintenance, and training, can deter adoption. While advancements like cloud-based solutions aim to reduce costs, the initial expenditure remains a barrier, particularly in emerging markets with limited healthcare budgets.
Complexity of Integration and Workflow Optimization is restricting market growth:
Integrating advanced visualization tools with existing healthcare systems can be complex and time-consuming. The lack of standardization across imaging modalities and software platforms often leads to compatibility issues. Moreover, healthcare professionals require extensive training to effectively utilize these systems, which can disrupt workflows during the implementation phase. These challenges, coupled with resistance to adopting new technologies, can slow market penetration, particularly in regions where healthcare infrastructure is underdeveloped.
Market Opportunities
The Advanced Visualization Market is experiencing significant growth opportunities, particularly within the rapidly expanding field of personalized medicine. Advanced visualization tools are critical in helping healthcare providers tailor treatment plans to individual patients by offering in-depth insights into disease progression and how patients are responding to therapy. These tools enable more accurate diagnoses and allow for highly customized, effective treatments, which is becoming increasingly important in modern healthcare. The integration of AI-powered tools and big data analytics is another key factor driving growth in the market. These technologies allow for more sophisticated analysis of medical images, facilitating better decision-making and improved outcomes. AI algorithms can automate tasks such as image analysis, enhancing diagnostic accuracy and saving time for healthcare professionals. The use of big data analytics further supports precision medicine, enabling healthcare providers to analyze large volumes of patient data and develop more targeted therapeutic strategies. As healthcare systems worldwide evolve, there is growing demand for cost-effective advanced visualization solutions, particularly among small and mid-sized healthcare providers. The development of affordable, scalable visualization tools can help these providers improve their capabilities and enhance patient care without the high costs associated with traditional systems. Additionally, expanding into untapped regions with increasing healthcare demands presents a significant opportunity for market players. Developing solutions suited to these regions' specific needs can drive adoption and boost market penetration. Furthermore, partnerships between technology providers and healthcare institutions are fostering innovation and accelerating market growth. Collaborations in research, product development, and deployment are paving the way for new advancements in visualization technology, ensuring that the market continues to evolve and meet the demands of modern healthcare. Overall, these trends are driving substantial growth and expanding the impact of advanced visualization in healthcare.
ADVANCED VISUALIZATION MARKET REPORT COVERAGE:
|
REPORT METRIC
|
DETAILS
|
|
Market Size Available
|
2023 - 2030
|
|
Base Year
|
2023
|
|
Forecast Period
|
2024 - 2030
|
|
CAGR
|
10.5% |
|
Segments Covered
|
By Product, Application, and Region
|
|
Various Analyses Covered
|
Global, Regional & Country Level Analysis, Segment-Level Analysis, DROC, PESTLE Analysis, Porter’s Five Forces Analysis, Competitive Landscape, Analyst Overview on Investment Opportunities
|
|
Regional Scope
|
North America, Europe, APAC, Latin America, Middle East & Africa
|
|
Key Companies Profiled
|
GE Healthcare, Siemens Healthineers, Philips Healthcare, Canon Medical Systems, Fujifilm Holdings Corporation, Agfa-Gevaert N.V., Carestream Health,TeraRecon, Vital Images, Ziosoft
|
Advanced Visualization Market Segmentation - By Product
-
Hardware
-
Software
-
Services
Software dominates the advanced visualization market, accounting for over 60% of the revenue share. This dominance is driven by the continuous development of AI-powered and cloud-based platforms that enhance diagnostic accuracy and workflow efficiency.
Advanced Visualization Market Segmentation - By Application
-
Radiology
-
Cardiology
-
Oncology
-
Neurology
-
Orthopedics
-
Others
Radiology is the leading application, contributing 40% of the market share. This is attributed to the widespread use of advanced visualization tools in diagnostic imaging, including CT and MRI scans, which are essential for detecting and monitoring a range of diseases.
Advanced Visualization Market Segmentation - By Region
-
North America
-
Asia-Pacific
-
Europe
-
South America
-
Middle East and Africa

North America is the dominant region in the Advanced Visualization Market, holding 38% of the revenue share. This can be attributed to the region's advanced healthcare infrastructure, high adoption rate of innovative medical technologies, and significant investments in research and development. Additionally, the growing prevalence of chronic diseases and the presence of leading market players strengthen North America's leadership position in this market.
COVID-19 Impact Analysis
The COVID-19 pandemic had a mixed impact on the Advanced Visualization Market. In the early stages, disruptions in healthcare services and a sharp decline in elective procedures temporarily slowed market growth. Many healthcare facilities were overwhelmed by the immediate demands of the pandemic, leading to delays in non-essential imaging and diagnostic procedures. As a result, the adoption of advanced visualization tools saw a temporary dip. However, as the pandemic progressed, the demand for advanced imaging technologies surged. Healthcare providers increasingly relied on these tools for accurate diagnosis, particularly for COVID-19-related complications such as pneumonia, respiratory distress, and organ damage. Advanced visualization solutions became crucial for assessing the severity of the virus, monitoring patient conditions, and guiding treatment plans. This spike in demand highlighted the essential role of high-quality imaging in managing both COVID-19 patients and a range of other critical conditions. The pandemic also underscored the importance of remote diagnostic tools and cloud-based platforms. With restrictions on in-person consultations and the rapid rise of telemedicine, healthcare providers turned to cloud-connected imaging solutions to facilitate remote diagnostics and consultations with specialists. This shift accelerated the adoption of cloud-based visualization platforms, which offer enhanced flexibility, data sharing, and collaboration across different healthcare facilities. As healthcare systems around the world recover and adapt to post-pandemic challenges, the Advanced Visualization Market is well-positioned for robust growth. Increased investments in digital healthcare solutions, coupled with the growing demand for precision medicine, are expected to drive continued market expansion. With healthcare systems now more focused on enhancing diagnostic accuracy and efficiency, advanced visualization tools will play a central role in the evolution of modern healthcare.
Latest Trends/Developments
The Advanced Visualization Market is experiencing rapid technological advancements that are transforming both its applications and capabilities. A key trend is the extensive integration of AI and machine learning into visualization tools. These technologies enable automated analysis of medical images, significantly enhancing diagnostic accuracy and reducing the time needed for interpretation. AI-powered tools can identify patterns and anomalies that may not be immediately visible to the human eye, improving early detection and enabling more precise treatment planning. Another significant development is the growing adoption of augmented reality (AR) and virtual reality (VR) in medical settings. In surgical planning, AR and VR are being used to create immersive, 3D visualizations of patient anatomy, allowing surgeons to practice and refine procedures before performing them on actual patients. In medical education, these technologies provide students and professionals with hands-on learning experiences, enhancing their understanding of complex medical concepts and improving learning outcomes. Hybrid imaging modalities, such as PET-MRI, are also gaining traction. These combined technologies offer comprehensive diagnostic insights by merging the strengths of positron emission tomography (PET) with magnetic resonance imaging (MRI). The resulting images provide more detailed and accurate information, which is crucial for diagnosing and monitoring conditions such as cancer and neurological disorders. Additionally, cloud-based solutions are becoming standard offerings in the advanced visualization market. Cloud platforms enable seamless storage, sharing, and collaboration, ensuring that healthcare providers can access imaging data remotely and collaborate with specialists regardless of location. These solutions also offer scalability, making them accessible to healthcare providers of all sizes. Together, these trends are reshaping the Advanced Visualization Market, driving innovation, improving diagnostic capabilities, and enhancing the efficiency and accessibility of healthcare worldwide.
Key Players
-
GE Healthcare
-
Siemens Healthineers
-
Philips Healthcare
-
Canon Medical Systems
-
Fujifilm Holdings Corporation
-
Agfa-Gevaert N.V.
-
Carestream Health
-
TeraRecon
-
Vital Images
-
Ziosoft


