Shore Power Market Size (2024 – 2030)
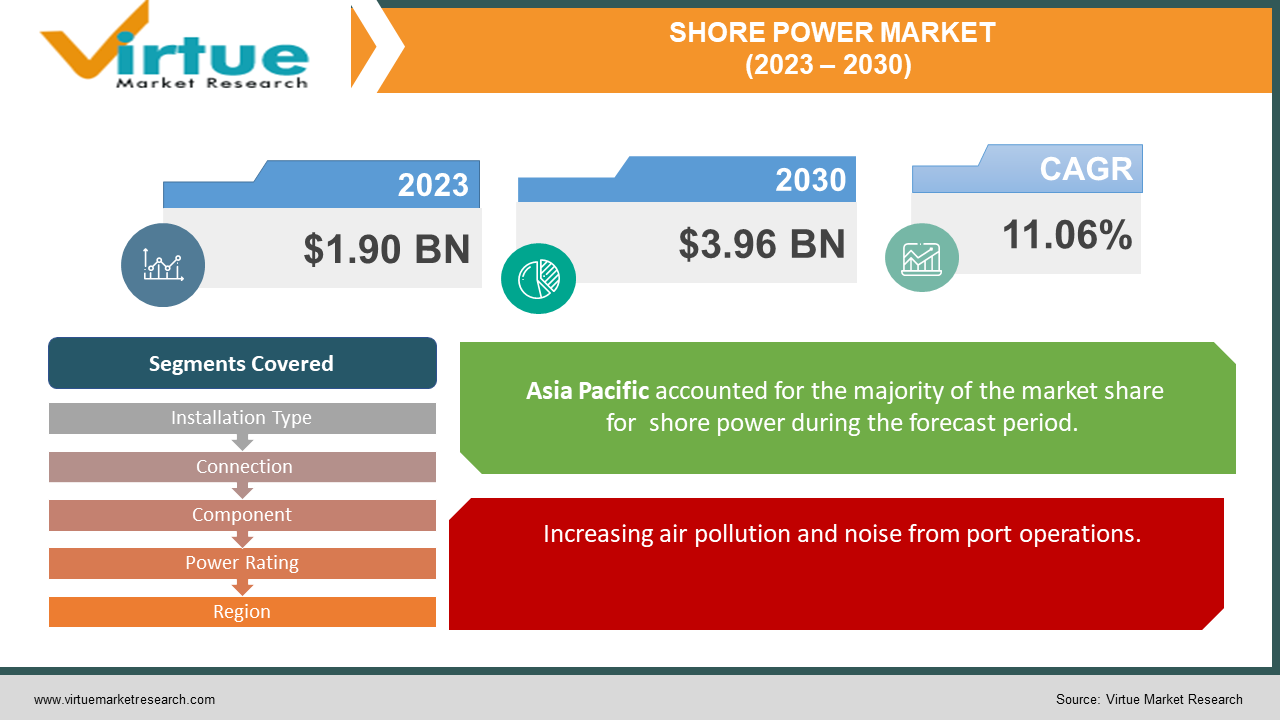
The Global Shore Power Market was valued at USD 1.90 billion and is projected to reach a market size of USD 3.96 billion by the end of 2030. Over the forecast period of 2024-2030, the market is projected to grow at a CAGR of 11.06%.
Ships need to keep their lights, heating, cooling, and other important functions running when they are docked at port. This is usually done using engines powered by diesel. Shore power, also known as ironing or marine power is a method of supplying electricity to a ship while it is docked. This allows the ship's auxiliary engines to be turned off and reduces the use of diesel fuel. Shore power is a way to reduce emissions and improve air quality. It cuts down on the amount of fuel used to power ships while they are, in port and decreases the pollution caused by that fuel consumption. Land-based electricity can be supplied through a utility company's grid. It is more common for it to come from a generator. These generators can run on diesel or energy sources, like wind or solar power.
Key Market Insights:
Based on the World Tourism Barometer report, by the United Nations World Tourism Organization there was a 4% rise in tourist arrivals from January to June 2019 totaling around 671 million visitors. This represents an increase of 30 million compared to the year. Moreover, cruise travel experienced a growth of 6% during the period of 2018 2019 equivalent, to 1.7 million more travelers.
Maritime U.K., a trade body has called on the government to allocate $235 million towards developing a charging infrastructure, for power and curbing emissions at ports.
The shore power market is experiencing growth due, to the increasing number of passengers traveling on cruise ships. According to the State of the Cruise Industry Outlook report released by the Cruise Lines International Association, there were 29.7 million passengers in 2019 who chose to embark on a cruise journey.
The European Commission has made it mandatory, for all ports to install shore connection systems. This government regulation aimed at reducing greenhouse gas emissions is expected to drive market growth in the future.
Shore Power Market Drivers:
Increasing air pollution and noise from port operations.
While ships that are anchored do not require propulsion it is crucial to have a supply of electricity, for operations. This power is typically generated using diesel engines and electrical generators. However, the operation of these diesel-based generators can result in the emission of air and noise pollutants. Such pollution poses risks to both workers and residents living near ports as inhaling this air can lead to lung damage and other health issues. To mitigate these concerns authorities are implementing shore power systems in ports, which help reduce both air and noise pollution while ensuring an environment, for everyone involved.
The International Chamber of Shipping states that 90% of trade is conducted via ships that rely on fossil fuels for power. However, the burning of these fuels results, in the emission of CO2, which contributes to climate change and acidification. Additionally, port activities release pollutants like SOx and NOx causing further damage, to our environment. To mitigate these issues the adoption of shore power systems proves beneficial as they effectively reduce air and noise pollution while minimizing their effects.
Shore Power Market Restraints and Challenges:
Significant capital expenditure requirements
Installing retrofitting existing shore power solutions, for ships and ports requires investment in electrical infrastructure development. While these enhancements are expected to reduce carbon emissions the cost of installation is quite high. For example, the Holland America Line shore power project at the Port of Seattle had a cost of $4.8 million. On average transformers (0.5 to 2 MW) for shore power systems can cost as much as $75,000 each making the overall installation cost range from approximately $0.5 2 million on the shipside. Similarly, shoreside installations can range from $5 million to $20 million. Retrofitting a shore power system can be more costly with prices reaching, up to $25 million depending on the system type and level of modification required.
Setting up shore power equipment involves the integration of components, like switchgear devices, frequency converters, transformers, and cables, with their accompanying accessories. This integration process demands workers since it entails connecting to the grid using underground cables, which adds to the overall cost of the procedure.
Shore Power Market Opportunities:
Using shore power technology to retrofit older ships and ports
Shore power systems have been, in use since 1980. Initially, this facility was only available for ships like pleasure craft ferries and other smaller boats. It didn't receive much attention due to the limited number of vessels relying on it. However, in the 2000s, there was a surge in the number of large-scale ships in the shipping industry. This increase resulted in CO2 and NOX emissions impacting the environment around ports. As a result shore power technology gained traction. Implementing shore power technology is now mandatory for constructed ports and ships in countries like Germany and China. Additionally, there is an opportunity to retrofit existing ports and ships with this technology due, to its increased adoption.
In times shore power systems have been undergoing advancements. For example, Wärtsilä has introduced a charging system that simplifies the transfer of power, from shores to ships replacing the cable connections used in shore power systems. This technology is especially useful for vessels that rely on batteries, like ferries, which spend less time at the dock. The key advantage of using a charger is that power transfer begins as soon as the vessel is docked eliminating the need to wait for cable connections. Several developed countries, including the US, Canada, Norway, Finland, Italy, and Sweden are upgrading their existing shore power solutions with technologies. The retrofit shore power market is expected to benefit from government initiatives and the development of wireless shore power systems, in the future.
SHORE POWER MARKET REPORT COVERAGE:
|
REPORT METRIC
|
DETAILS
|
|
Market Size Available
|
2023 - 2030
|
|
Base Year
|
2023
|
|
Forecast Period
|
2024 - 2030
|
|
CAGR
|
11.06% |
|
Segments Covered
|
By Installation Type, Connection, Component, Power Rating, and Region
|
|
Various Analyses Covered
|
Global, Regional & Country Level Analysis, Segment-Level Analysis, DROC, PESTLE Analysis, Porter’s Five Forces Analysis, Competitive Landscape, Analyst Overview on Investment Opportunities
|
|
Regional Scope
|
North America, Europe, APAC, Latin America, Middle East & Africa
|
|
Key Companies Profiled
|
Schneider Electric, Cavotec, Wartsila, Vinci energies, Danfoss, ABB (Hitachi), Esl power systems, Igus, Blueday technology, Cochran marine
|
Shore Power Market Segmentation: By Installation Type
The Shore Power Market can be divided into two segments; Shoreside and Shipside. Currently, the Shoreside segment has the market share accounting for 59% in 2023. Is expected to maintain its dominance, in the global market throughout the forecast period. The primary reason for this dominance is the installation costs associated with shoreside shore power systems due to the requirement of electrical components, along the coast. These additional components enable shoreside shore power systems to be more adaptable and meet the power requirements of types of vessels.
Shore Power Market Segmentation: By Connection
-
New installation
-
Retrofit
The Shore Power Market can be divided into two categories; New Installation and Retrofit. Among these, the New Installation segment currently holds the market share accounting for 33% in 2023. The main reasons driving this growth include the installation costs and an increasing number of countries implementing environmental regulations. As, per these requirements shore power systems are being installed in ports that are still under construction and, on boats that have not yet been commissioned. Additionally, new installations cover both shipside and shoreside installations thus capturing a portion of the market.
Shore Power Market Segmentation: By Component
-
Transformers
-
Switchgear Devices
-
Frequency Converters
-
Cables and Accessories
-
Others
According to the analysis of shore power systems, it is projected that the market, for converters will experience massive growth. Frequency converters play a role in reducing the consumption of diesel fuel, which leads to a decrease in carbon emissions. Additionally, they also contribute towards minimizing noise pollution. These factors are driving the adoption of converters, in ports. Consequently fueling market expansion.
Shore Power Market Segmentation: By Power Rating
-
Up to 30 MVA
-
30-60 MVA
-
Above 60 MVA
During the forecast period, it is expected that the segment, with a power output of up to 30 MVA will have the market share. These shore power systems, which have a power output of up to 30 MVA are advantageous due to their dimensions and lower capital investments. Many ports prefer these systems because they can be deployed without making modifications, to the existing power grid systems.

Shore Power Market Segmentation: Regional Analysis
-
North America
-
Asia-Pacific
-
Europe
-
South America
-
Middle East and Africa
The Asia Pacific region had the market share making up 37% in 2023. This growth can be attributed to the increased utilization of shore power systems and the presence of some of the biggest ports, in the world within this region. According to data from the World Bank China accounted for 31% of container port traffic in 2021 which amounted to a staggering 242.030 million TEU. Moreover, countries like Japan, South Korea, Australia, and Singapore have actively been working on developing guidelines to reduce pollution caused by port activities. These efforts are expected to drive expansion, in the APAC market throughout the projected period.
The American market is projected to experience a compound growth rate (CAGR) of 6.7% throughout the anticipated period. The region's expansion can be attributed to the rise, in retrofitting activities as efforts, towards reducing low-frequency noise and emissions at ports.
COVID-19 Impact Analysis on the Global Shore Power Market:
The worldwide pandemic caused by the spread of the coronavirus has negatively affected all sectors. Many industries have experienced disruptions, in their operations due to the implementation of measures like lockdowns to curb the spread of COVID-19. Additionally, the closure of essential businesses and operating with reduced staff has had an impact on both domestic and international trade. Since maritime activities play a role in markets the long-term decline in the marine and trade industry has also affected investments, in this sector directly impacting the maritime industry.
Latest Trends/ Developments:
The shore power sector is experiencing growth due, to the rising number of passengers on cruise ships. As per the Cruise Lines International Association State of the Cruise Industry Outlook report, there were 29.7 million passengers globally in 2021. North America had the rate of cruisers with 15.4 million passengers traveling during that year. The United Nations World Tourism Organization World Tourism Barometer report shows that foreign tourist arrivals increased by 4% from January to June 2021 reaching a total of 671 million, which is over 30 million more than the year. The number of cruise passengers has seen an increase of 1.7 million from 2017, to 2021 representing an almost 6% rise. Consequently, the shipping industry is experiencing a rise, in the number of cruise lines, including Carnival Cruise Lines, Celebrity Cruises, Costa Cruises, Norwegian Cruise Lines, Royal Caribbean International, Saga Cruises, and various other companies.
With the increasing availability of terminals and changes, in regulations, shipping companies are now integrating power into new vessels and upgrading existing ones. The demand for this technology will be boosted by investments in retrofitting ports. For instance, Global Ports Holding invested $250 million in expanding the capacity and upgrading the Nassau cruise port, which started operations in October 2021. In June 2020 Hamburg, Haropa Port, Antwerp, Bremerhaven, and Rotterdam jointly declared their commitment to zero-emission shipping, as part of their green ports strategy. They highlighted the benefits of equipping container ships with shore power and their readiness to adopt cold ironing practices. Consequently, the growth of the port will be facilitated by the addition of terminals and retrofit installations.
Key Players:
-
Schneider Electric
-
Cavotec
-
Wartsila
-
Vinci energies
-
Danfoss
-
ABB (Hitachi)
-
Esl power systems
-
Igus
-
Blueday technology
-
Cochran marine
In November 2021 GE Power Conversion was granted a delivery/quantity (IDIQ) contract, by the U.S. Navy Military Sealift Command (MSC) to oversee the upkeep of the electric and hybrid electric power and propulsion systems on their ships. This contract is valid for five years. Holds potential, for future collaboration.
In March 2021 Germany Port of Kiel engaged Siemens Smart Infrastructure to implement a Cloud-based power monitoring solution, for their shore power system with an estimated value of, around USD 125 million.


